elastic-charts
 elastic-charts copied to clipboard
Cluster node performance (storage, heap and CPU)
Is your feature request related to a problem? Please describe.
Deployment administrators need to know how their Elasticsearch cluster is doing, performance wise. For each cluster node, HW wise, there are 3 parameters that matter:
- JVM memory pressure (heap)
- CPU usage
- Storage allocation
And we need to find a visual way to represent that.
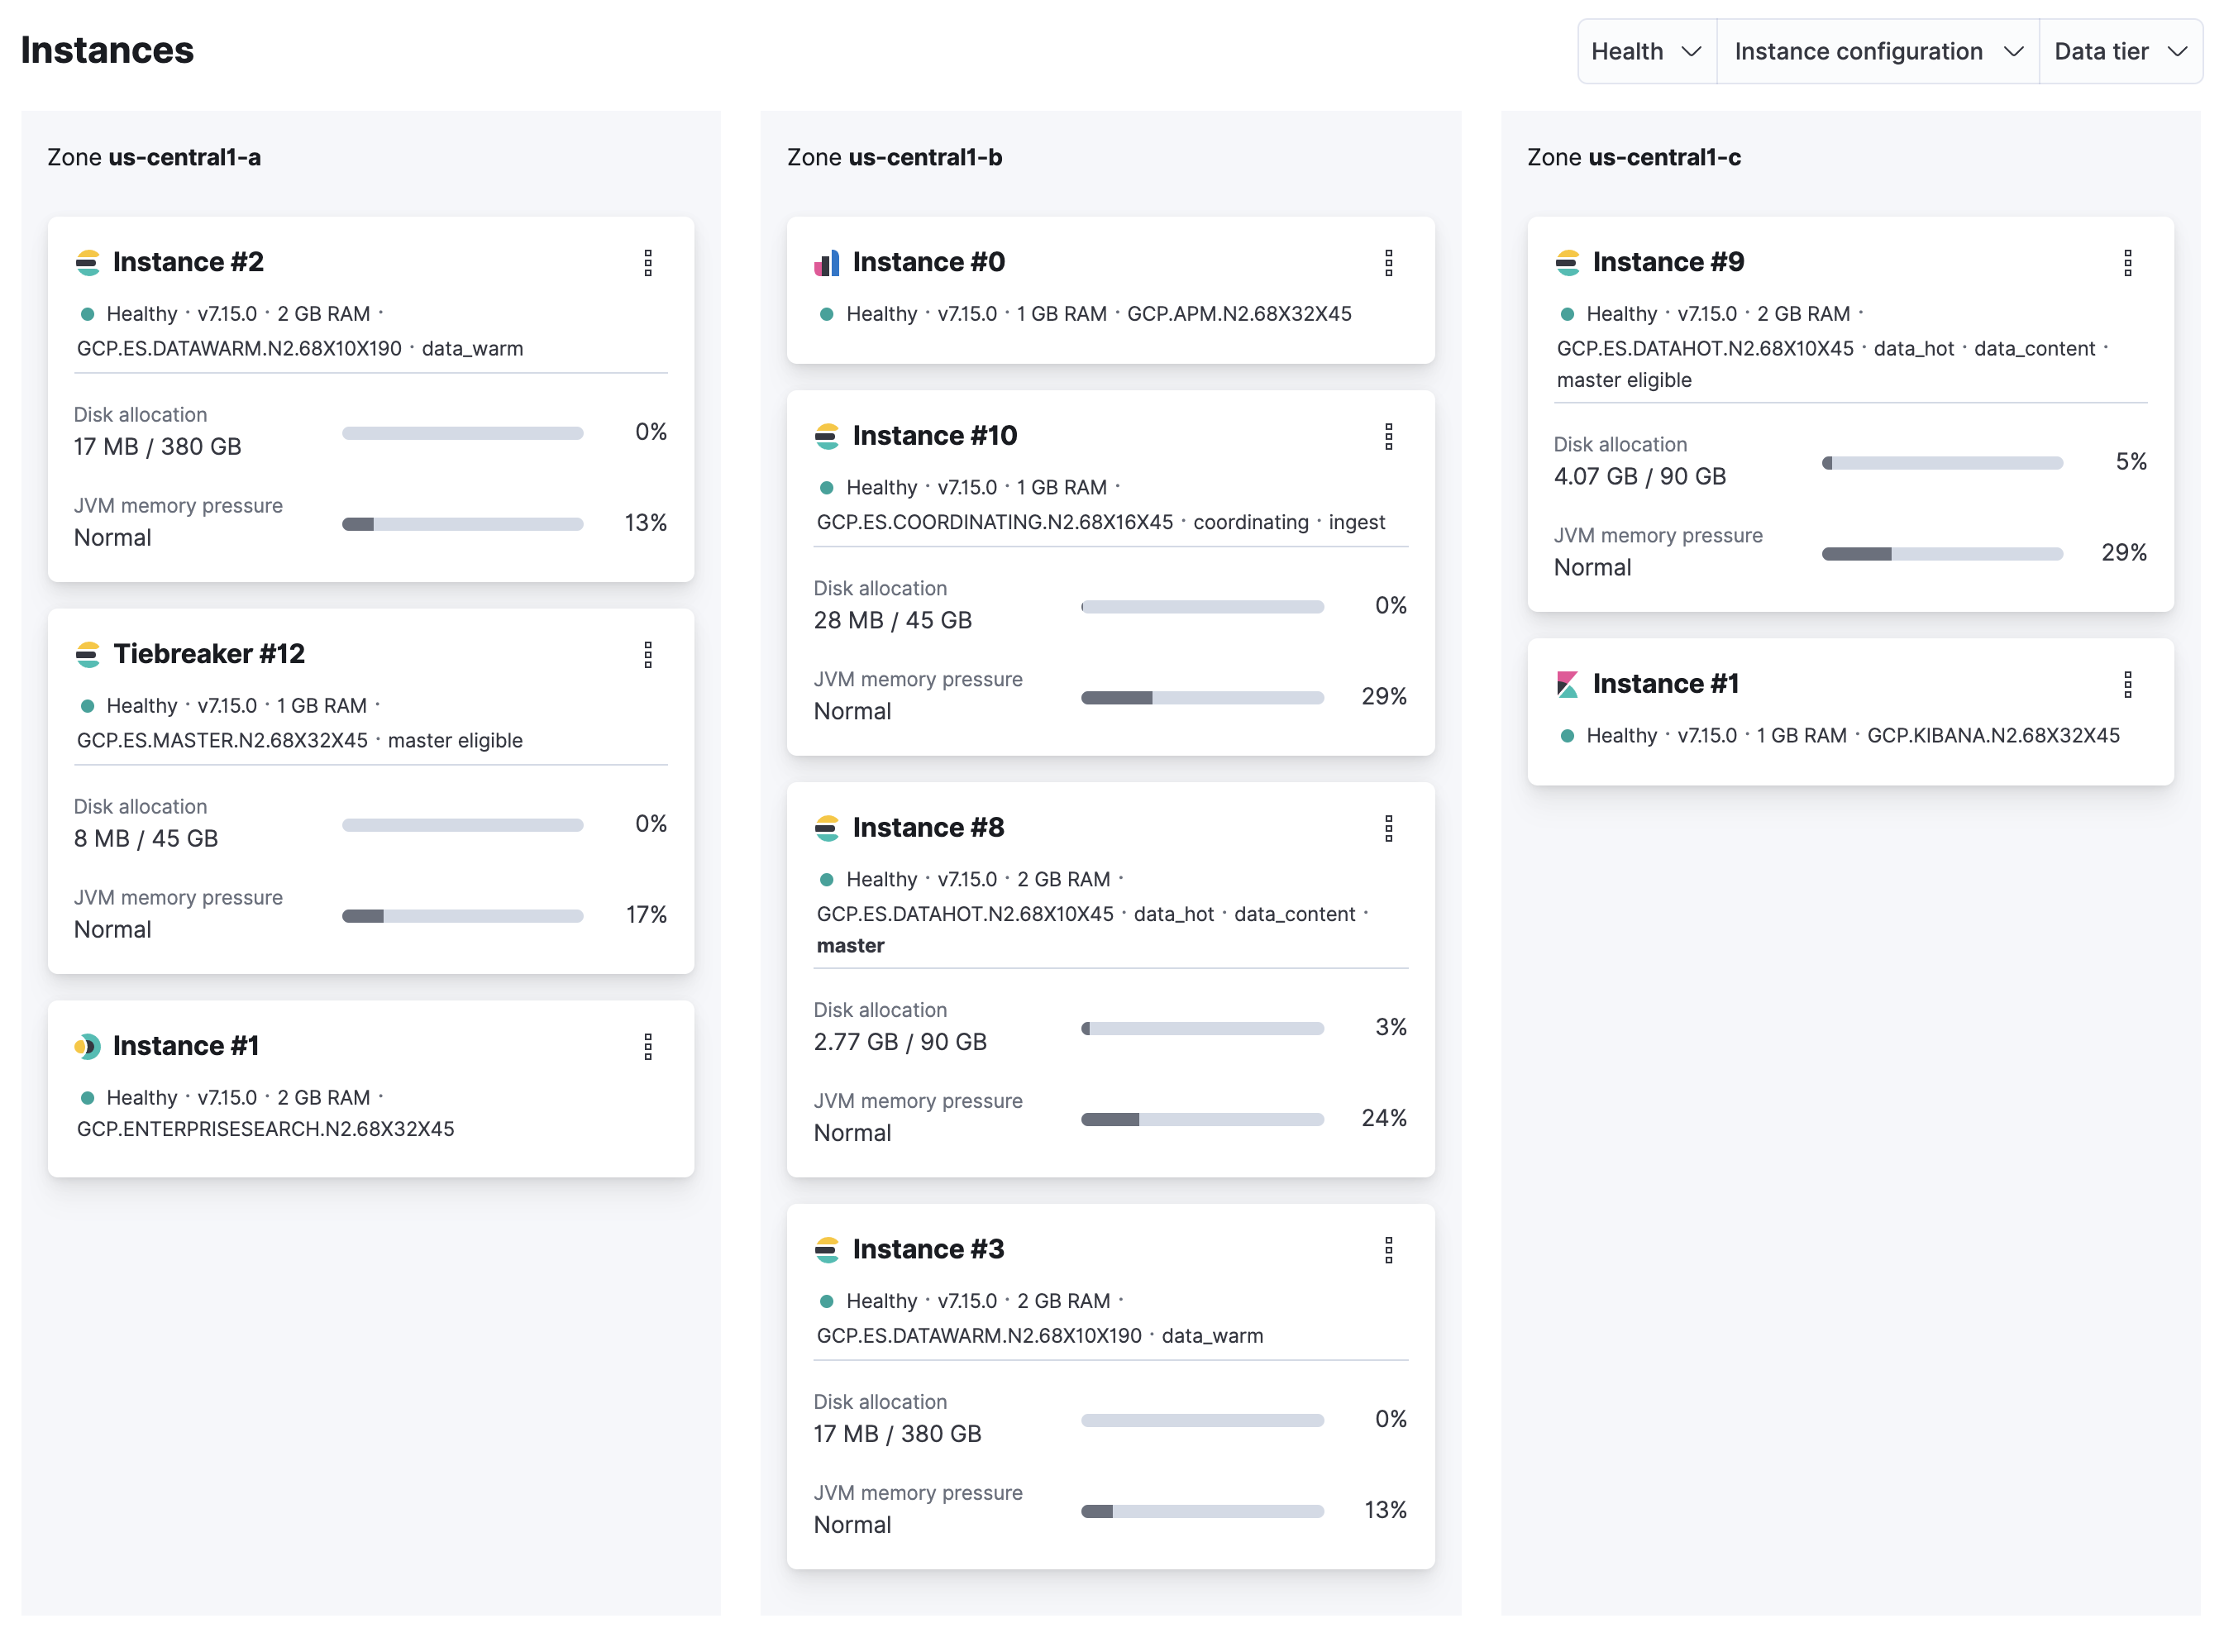
Right now, we show the last 2 parameters in cloud, under the Instances section of a deployment. The layout isn't very visual and it's overwhelming the user with information that isn't necessary or useful, until you have a problem with the node.
Describe the solution you'd like
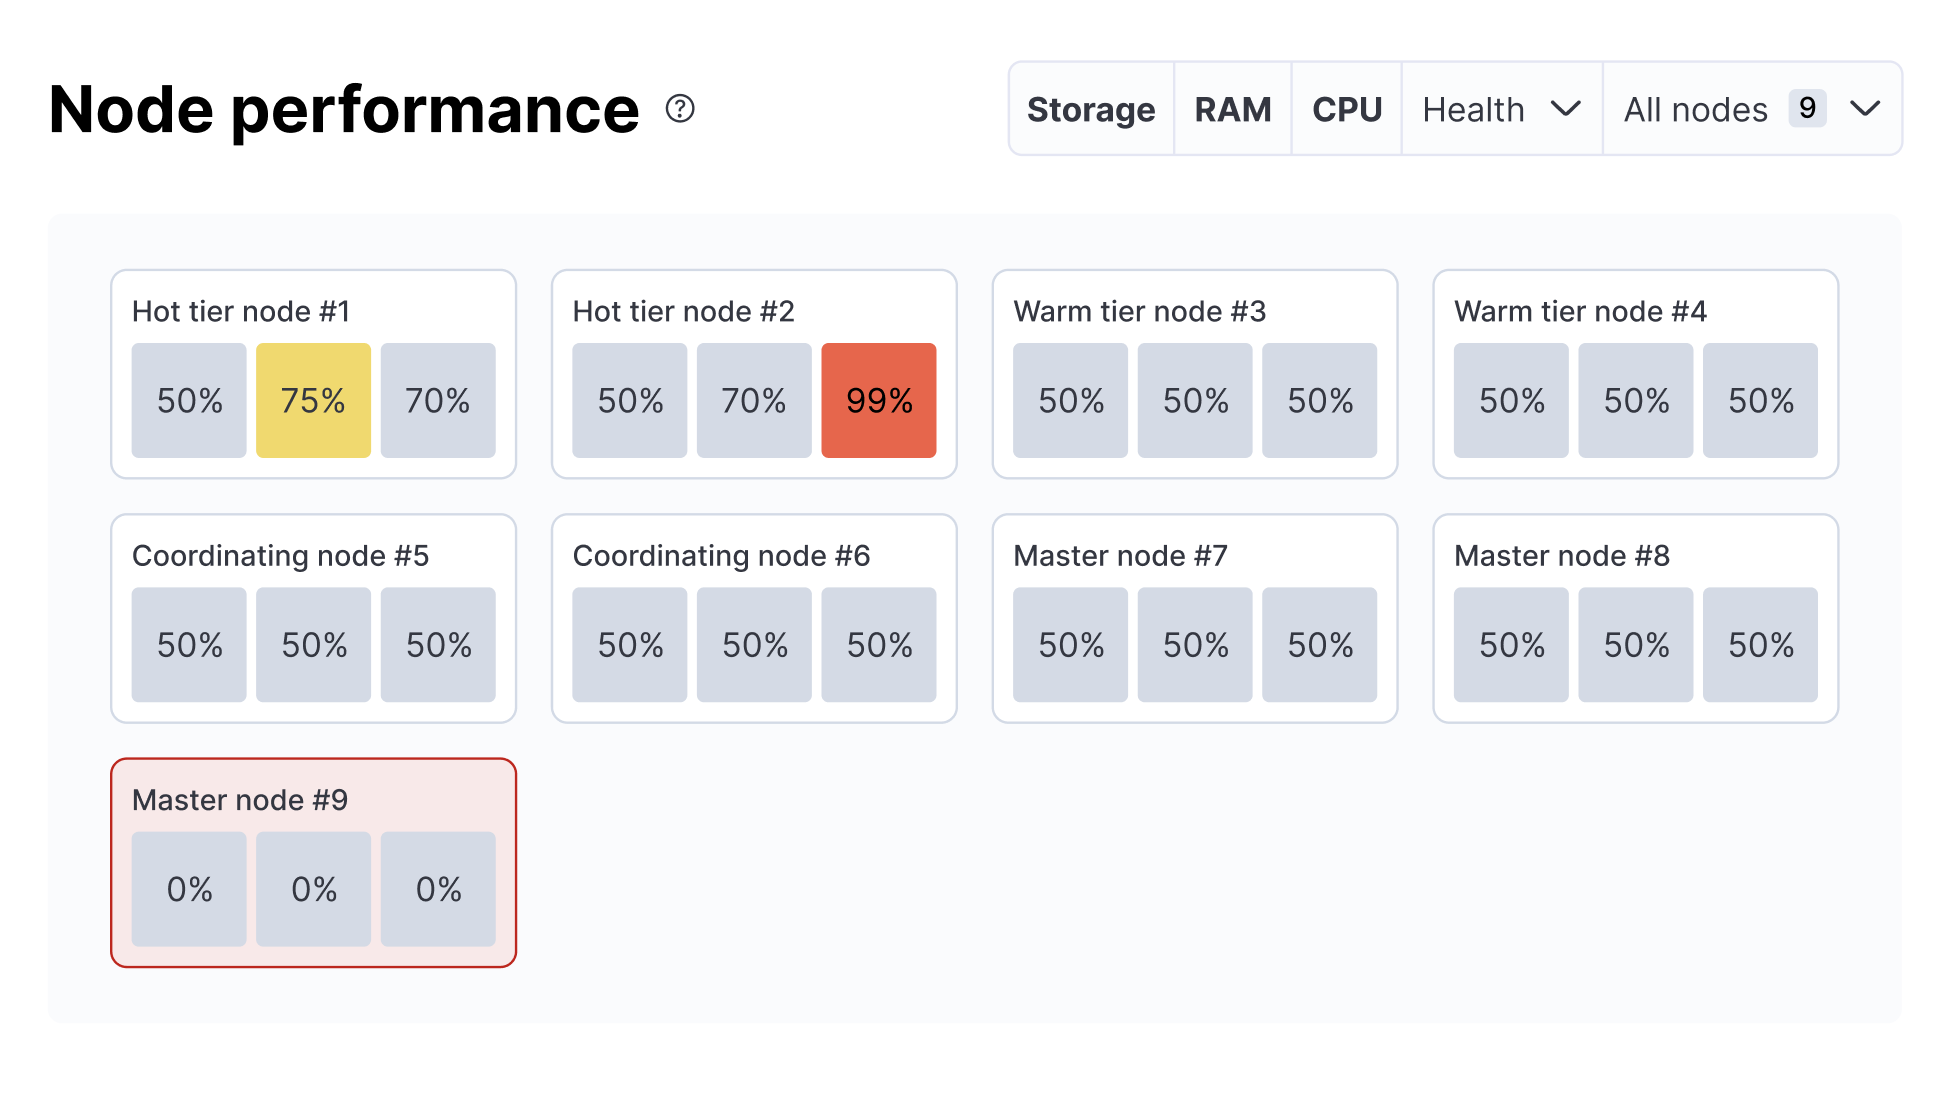
We'd need a 3 parameter component per node, that shows heap, CPU usage and storage. A cluster can have between 1 node and tens of nodes, so it needs to scale well.
Ideally, the node viz should also be able to show the overall health of each node, which can be:
healthystopped routing requestsunhealthy
High CPU usage does not make a node unhealthy, nor does high JVM memory pressure.
Each parameter should be actionable.
I'd like to give users the filters for:
- node types
- node health
- deciding which parameters they want to see.
I'm not married to this idea and am very open to different explorations 🙂
Describe alternatives you've considered
Now showing the name of the node, and have it display on hover:

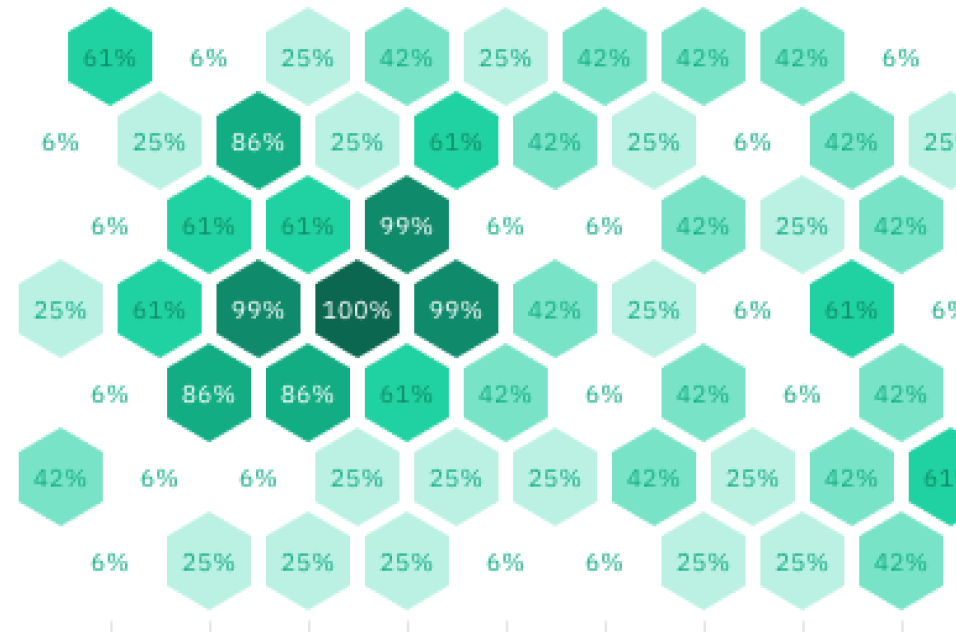
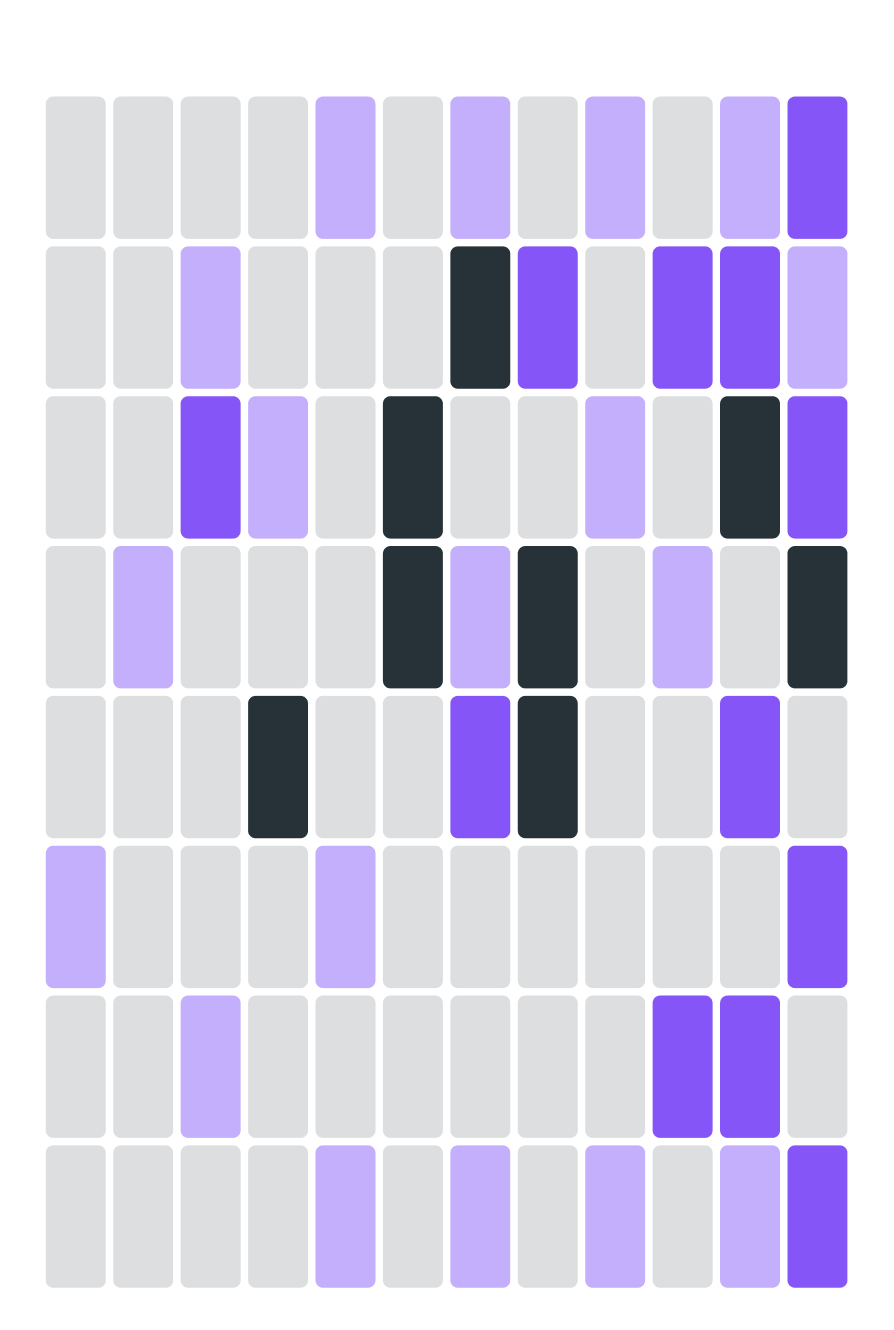
Additional context Inspiration
| 1 | 2 | 3 |
|---|---|---|
 |
 |
 |
here's a similar discuss post of someone trying to do APM inventory vis from a dashboard and getting hung up on how to do it - https://discuss.elastic.co/t/how-to-create-birds-eye-visualization-in-kibana/290628/
Closing this because it's not planned to be resolved in the foreseeable future. It will be tracked in our Icebox and will be re-opened if our priorities change. Feel free to re-open if you think it should be melted sooner.