eland

eland copied to clipboard
Implement DatetimeIndex
See pandas.DatetimeIndex and date_range.
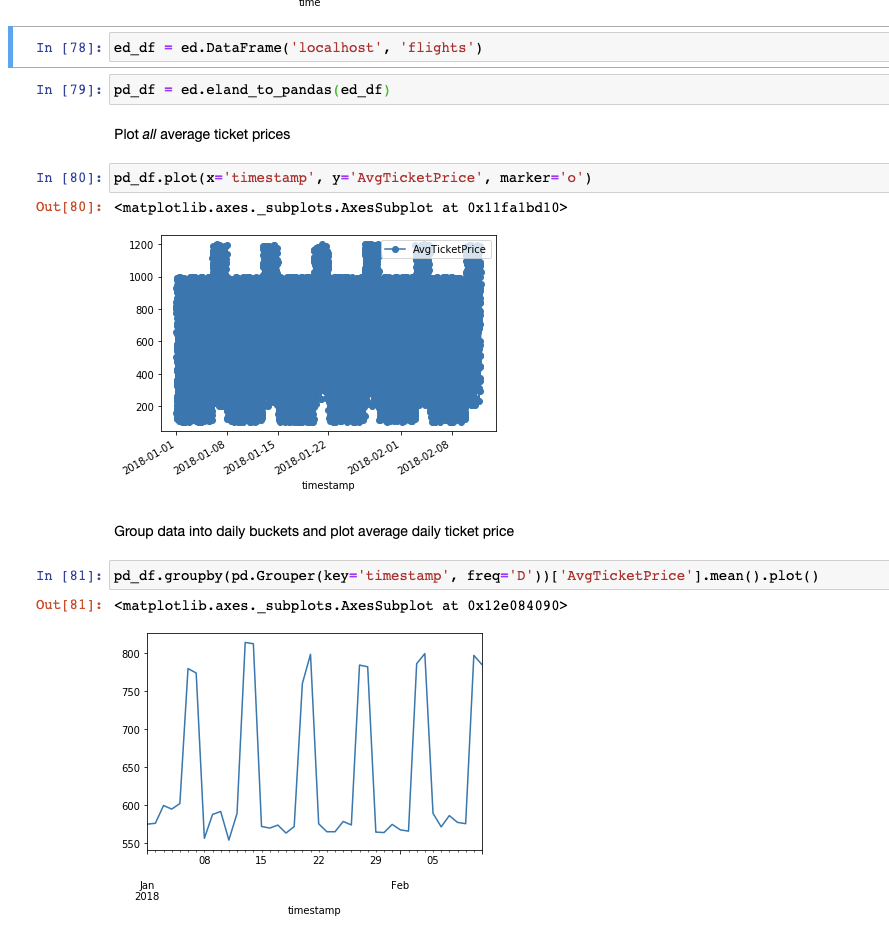
End goal is to be able to visualize time-series data on a histogram.
There are a couple of parts to this issue (which could be split into parts):
- Plot a time series based on x=datetime column (potentially downsampling in ES)
- Bucket data into hourly/daily etc. buckets
- Set index to DateTimeIndex and use date_range and other methods
e.g.