cloud-on-k8s
 cloud-on-k8s copied to clipboard
Enable beats stack monitoring configuration
Closes #5563
This change enables easy stack monitoring configuration for Beats, such as we already have for both Elasticsearch and Kibana, by adding the following configuration stanza in the Beats CRD
apiVersion: beat.k8s.elastic.co/v1beta1
kind: Beat
spec:
  monitoring:
    metrics:
      elasticsearchRefs:
      - name: elasticsearch
    logs:
      elasticsearchRefs:
      - name: elasticsearch
@pebrc I've reached out to observability, and they also suggested we use sidecars to monitor these instead of internal collectors. My changes to allow sidecars is nearly complete, with some unit tests for the functionality being taken care of, and I'll note that this is ready for another look.
I left a few comments. In my tests the metrics never showed up in the "Stack monitoring" view in Kibana. It wasn't clear to me what was the root cause for this (e.g. I added the missing UUID) but I guess it warrants further investigation.
Yeah, it's not showing up in stack monitoring for some reason for me either, but the data is definitely getting into the indices (same for filebeat, but not shown)
I'll figure out the reason for the missing stack monitoring kibana piece.
Also, I'm working through the comments....
I believe this is now ready for more 👀 . I'm just verifying the e2e tests at this time.
I did a quick test, haven't looked at the code yet. But somehow the UI still does not show content
There is data flowing into my monitoring cluster though. Not sure what is going on with the stack monitoring UI. Going to take a closer look tomorrow.
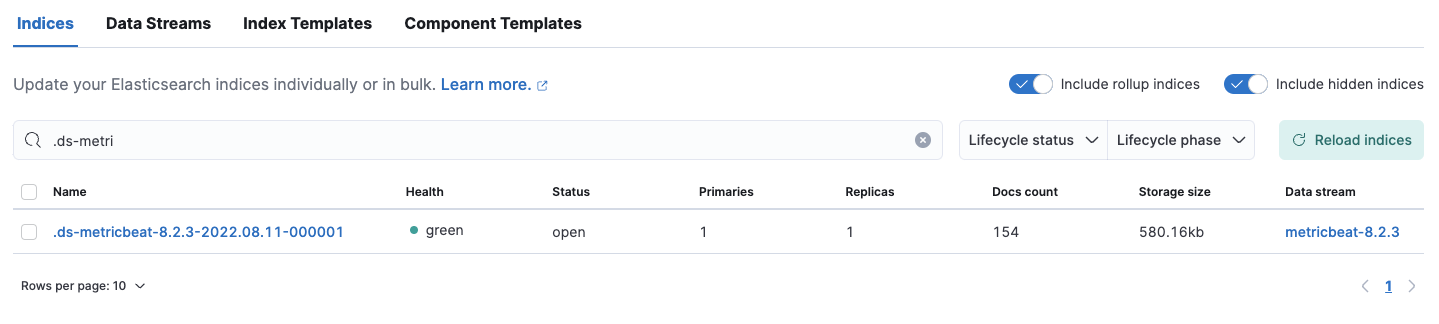
green open .ds-metricbeat-8.3.2-2022.08.18-000001       qnmXL7hNQeKIecbdeJ3yhQ 1 1    99 0 214.2kb 106.4kb
green open .ds-filebeat-8.3.2-2022.08.18-000001         Wwi6mAX0T1Cczfs-dQDc4w 1 1 12178 0   2.8mb   1.3mb
green open .ds-.monitoring-beats-8-mb-2022.08.18-000001 851mItfaS7iiCbYwB5yQ2g 1 1   139 0 511.1kb 248.6kb
All that is ingested are the sidecars own logs.
I'm working through this... seeing odd issue where something is listening on 5066, even though I am disabling this http endpoint in both filebeat, and metricbeat sidecars. I'll update when it's resolved.
Exiting: could not start the HTTP server for the API: listen tcp 127.0.0.1:5066: bind: address already in use
metricbeat, and filebeat (or any 2x beats) running on the same host, listening on 127.0.0.1:5066 seem to be the cause of this... I'm investigating a solution.
metricbeat-beat-metricbeat-4bs56            2/3     CrashLoopBackOff   10 (68s ago)   27m   10.142.0.41   gke-mmontgomery-testcluster01-pool-1-9b30cf4a-9eg2   <none>           <none>
filebeat-beat-filebeat-cx52x                2/2     Running            2 (27m ago)    27m   10.142.0.41   gke-mmontgomery-testcluster01-pool-1-9b30cf4a-9eg2   <none>           <none>
metricbeat, and filebeat (or any 2x beats) running on the same host, listening on
127.0.0.1:5066seem to be the cause of this... I'm investigating a solution.
As I suspected, this is the culprit. If any 2x beats, with stack monitoring, and hostNetwork: true end up on the same host, this port conflict will occur...
hostNetwork: true
I'm thinking through some sort of solution to this that's deterministic in which all ports, assigned to any beat with stack monitoring enabled can be consistent for each reconciliation cycle.
I'm thinking through some sort of solution to this that's deterministic in which all ports,
Could you give more details about your solution?
- If deployed as a daemonset do we want to use the same port on all the nodes?
- How to not collide with ports already opened on the node?
- Is there any security consideration to have?
- Any chance to have the Beats team working on a Unix socket based interface?
@barkbay I don't currently have a solution to this problem. I'll document here some potential (partial) solutions here that I've been working through, but none of them fully stop the potential for port conflicts when using hostNetwork: true, but that's true for ANY pod that uses this setting...
Ensure distinct http.port setting for each Beat daemonset, with stack monitoring enabled, and hostNetwork: true set.
For each Beat that is both a daemonset, and has stack monitoring enabled with hostNetwork: true set, we could have a package that returns a distinct http.port, starting at 5066 and incrementing.
- We would have to 'save' the assigned stack monitoring port (likely) in the
statusof the Beat object for future queries. - This wouldn't fully resolve the issue, as a customer could have something running on 5066 on the host already, which would collide with the Beat.
- Multiple operator instances running within the same cluster would potentially run into issues, as they wouldn't share this data, unless we persist this data in a shared configmap that multiple operators query.
Adjust the monitoring section for Beat to require that the user assign a monitoring port when hostNetwork: true is set.
This solution move the onus to the user to ensure that the stack monitoring ports for Beat within the cluster do not collide.
- Again, multiple operators running within the same cluster could run into issues, as they may not have the RBAC rules to query Beats outside of their assigned namespaces for port assignments when validating the Beat object upon initial validation/creation.
- Also has the potential problem where the k8s nodes may have something already running on the node, on the assigned port, that the user is unaware of.
Document the potential port conflict, and remove any hostNetwork: true settings from Beat types that do not require it.
There are indications that hostNetwork: true is not fully required for Beats to function in certain Beat types, see issue comment. If this is true, we could remove hostNetwork: true from our recipes/documentation for the Beats that do not require this setting (metricbeat/packetbeat seem to be the only ones that should 'require' this setting). In this scenario, we could document the potential for port conflicts when hostnetwork is used, and leave it up to the user to avoid this scenario.
Let me know if you have strong feelings for/against these options. I personally do not like assigning ports starting at 5066 and incrementing, as it seems likely run into a port conflict issue sooner or later, and the user would be pretty blind to the reason it's happening. It also seems as though we should pursue removing hostNetwork: true from our recipes for Beats that do not require it regardless of the final solution we pursue here.
To answer the questions you specifically asked:
- If deployed as a daemonset do we want to use the same port on all the nodes?
I think you're asking if 2x beat daemonsets should use the same port for each daemonset. I'd say likely not if stack monitoring is enabled, and hostNetwork: true is set for both of them.
- How to not collide with ports already opened on the node?
I don't know of any way to stop this from happening when a server on the k8s node is run outside of k8s that binds to a port.
- Is there any security consideration to have?
We are opening port 5066 on the node's host network when stack monitoring is enabled, so any process on the host could query the Beat's metrics, so that's a potential security risk depending on the data that's served over the monitoring server.
- Any chance to have the Beats team working on a Unix socket based interface?
~~I will bring this up with the Beats team to see their thoughts.~~ Unix sockets/Windows pipes are supported from the documentation. I'll test this option.
@barkbay unix sockets/windows pipes appear to be a valid option, which could be named according to namespace/name, and solve this problem: https://www.elastic.co/guide/en/beats/metricbeat/current/http-endpoint.html.
I'll do some testing and see what comes of this...
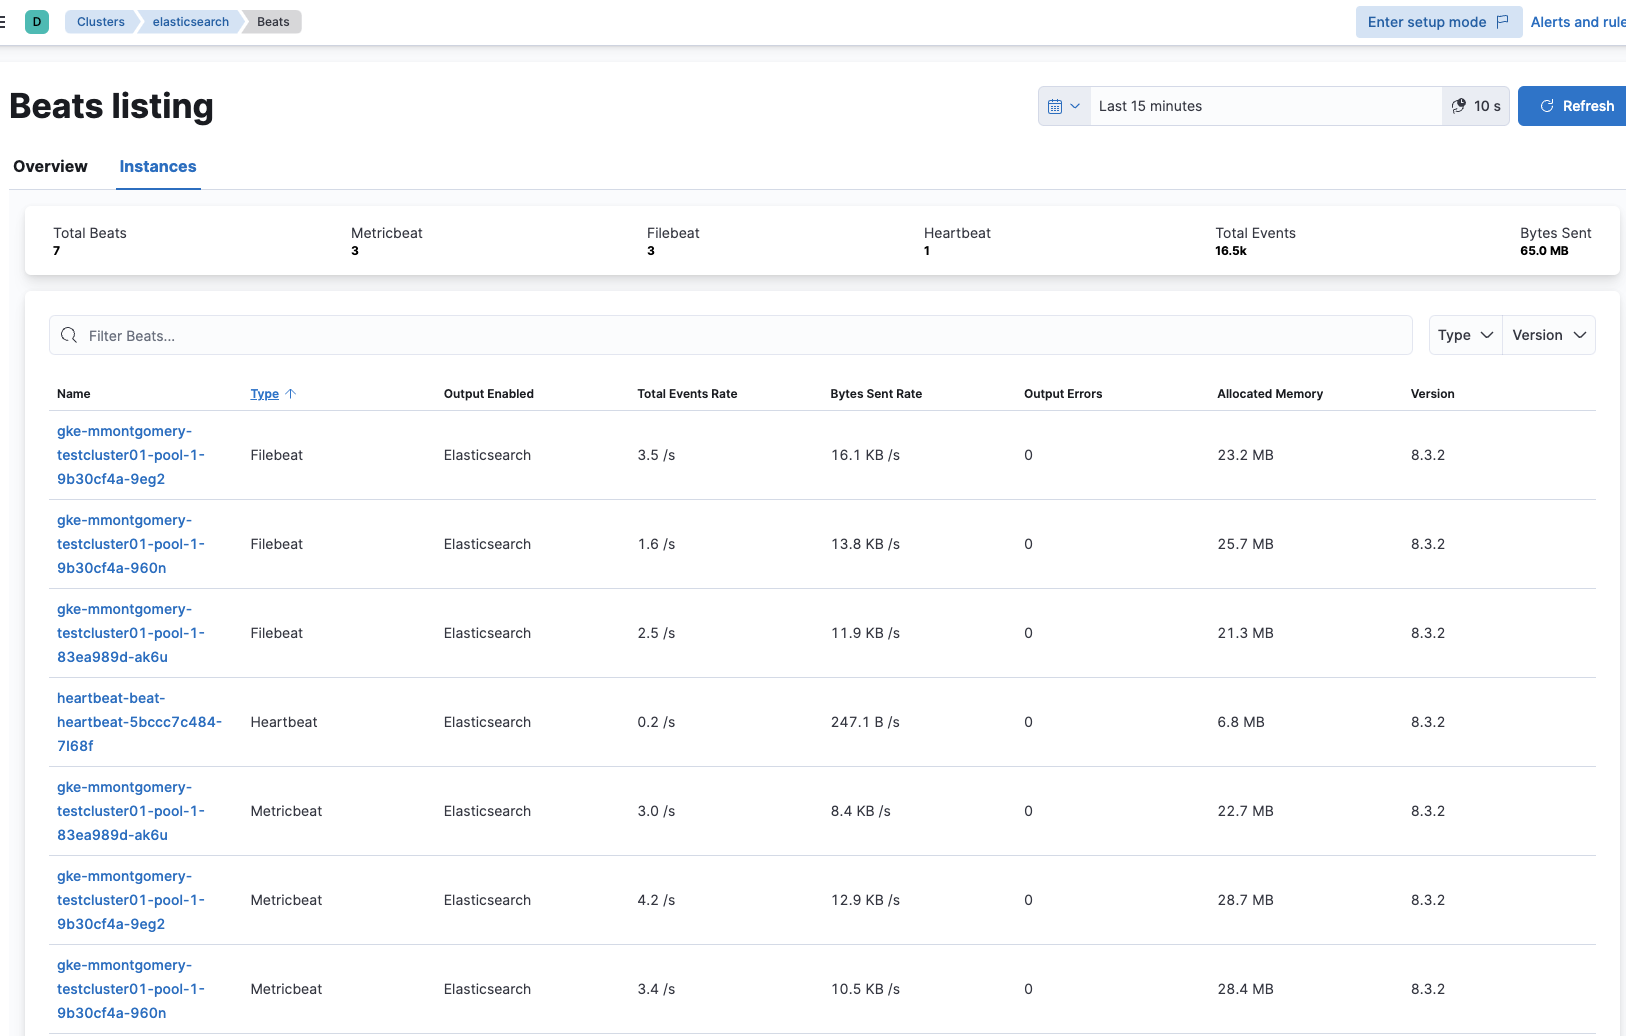
Beats stack monitoring now works over unix sockets, which solves the issues where we were getting port conflicts on host network.
This looks good! I'm testing with this manifest and I get a socket permission error for Filebeat:
{
    "log.level": "error",
    "@timestamp": "2022-09-09T13:40:34.362Z",
    "log.origin": {
        "file.name": "module/wrapper.go",
        "file.line": 256
    },
    "message": "Error fetching data for metricset beat.state: error making http request:
 Get \"http://unix/state\": dial
 unix /var/shared/filebeat-default-filebeat.sock: connect: permission denied",
    "service.name": "metricbeat",
    "ecs.version": "1.6.0"
}
I'm investigating these permission issues...
@thbkrkr meant to update yesterday. The permission errors were from attempting to use /usr/share/filebeat-sidecar as the path for the filbeat sidecar, which was unnecessary. I removed that from the config template, tested your manifest locally, and saw no issues. This should be ready for 👀 again.
@thbkrkr There were additional issues found surrounding sidecar permissions reading the unix socket. These were resolved, and tests were added around this feature. It's again ready for 👀
I stepped into a trap when testing this yesterday by using one of our existing manifests with the -e option and only with @thbkrkr 's help was able to identify that this was the reason why my logs would not show up in the monitoring cluster.
I think we have a usability issue here with some of the existing recipes using the -e option. We can assume that some of our users also might have specified it when overriding the default beats command. I think we should at least document this requirement and maybe even consider, as @thbkrkr suggested, to automatically remove the -e option if log delivery is configured.
I think we have a usability issue here with some of the existing recipes using the
-eoption. We can assume that some of our users also might have specified it when overriding the default beats command. I think we should at least document this requirement and maybe even consider, as @thbkrkr suggested, to automatically remove the-eoption if log delivery is configured.
I didn't think of the scenario where the customer/recipe already had the -e option. Resolved in https://github.com/elastic/cloud-on-k8s/pull/5878/commits/52cd829cc6259cc1bdbd81158f845318bcd384f6. I'll also get the documentation updated to note this.