tdsharp
 tdsharp copied to clipboard
TDLib.Samples.GetChats.csproj memory leak
Hello. I cloned the repo, ran TDLib.Samples.GetChats.csproj and found that memory consumption increases even without any application activity:
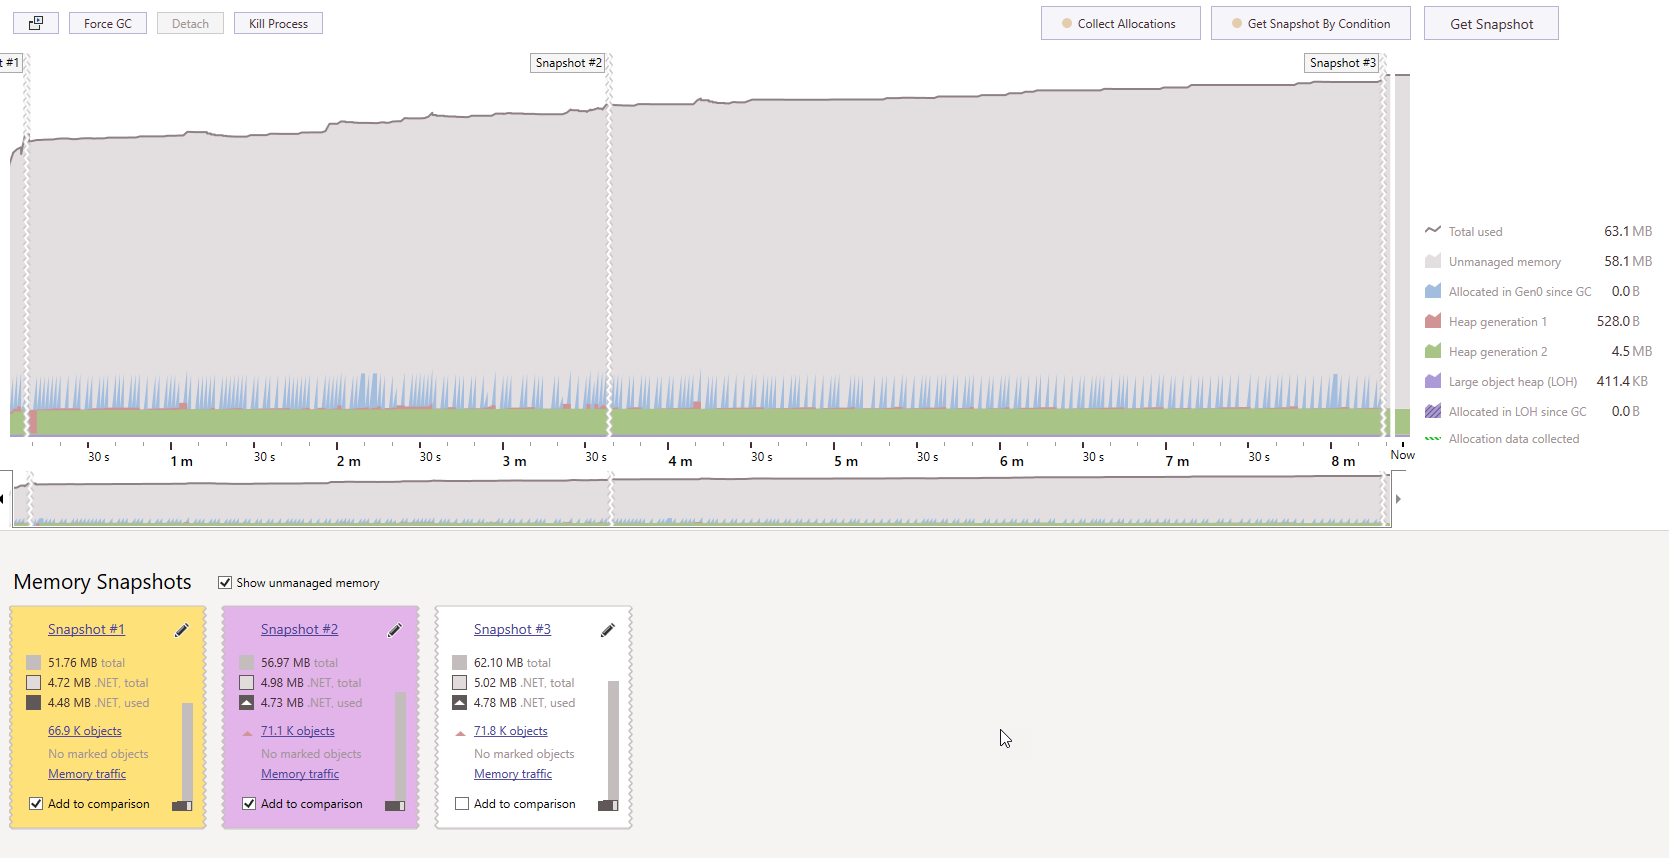
I tried to remove getting channels code from the sample - the result is the same.
Can it be a memory leak?
tdlib.native 1.7.9.1
Yes, it can, but from this profile, it looks like a native memory leak. So, unfortunately, you'll have to profile the underlying tdlib, and not the managed part.
(though it's also possible that this memory is reserved by .NET runtime or something; in any case, this doesn't look like a managed memory leak from tdsharp)
Thanks for the answer. But why do you think about native memory leak first of all? I see that the number of managed objects is increasing.
On your chart, the amount of unmanaged memory raises, while the amount of managed memory looks constant.
If you believe any managed objects are leaking, then the snapshot analysis should help.
Unfortunately, I cannot reproduce your results on 1.8.1.
Have you been able to analyze the snapshots?
No answer for several months; I consider this resolved. If you still have a problem, feel free to drop a comment.