modelbased
 modelbased copied to clipboard
Support _metafor_ package (predictions and plots)
Hi,
It seems that model_parameters() isn't calculating the correct point estimate (and 95% CI) for all subgroups in a metafor::rma() object. Below, I show that predict() and emmeans() yield the same results for all subgroups, while model_parameters() only recovers the "alternate" subgroup correctly.
# remotes::install_github("wviechtb/metafor") # install version 3.9-5
library(metafor)
library(emmeans)
library(parameters)

dat <- metadat::dat.bcg

datRR <- metafor::escalc(measure="RR",
                         data=dat,
                         ai=tpos, bi=tneg, ci=cpos, di=cneg)

res <- metafor::rma(data=datRR,
                         method = "REML",
                         mods = ~ alloc,
                         yi = yi, vi = vi,
                         slab = author)
predict(res, newmods = rbind(c(1,0), # Random effects
                             c(0,0), # alternate
                             c(0,1)), # systematic
        digits=3)
#>
#>     pred    se  ci.lb  ci.ub  pi.lb pi.ub
#> 1 -0.966 0.267 -1.490 -0.442 -2.255 0.324
#> 2 -0.518 0.441 -1.383  0.347 -1.980 0.944
#> 3 -0.429 0.345 -1.105  0.247 -1.788 0.930
gr <- metafor::emmprep(res) # version 3.9-5 required

emmeans::emmeans(gr, specs = ~alloc)
#>  alloc      emmean    SE  df asymp.LCL asymp.UCL
#>  alternate  -0.518 0.441 Inf     -1.38     0.347
#>  random     -0.966 0.267 Inf     -1.49    -0.442
#>  systematic -0.429 0.345 Inf     -1.10     0.247
#>
#> Results are given on the log (not the response) scale.
#> Confidence level used: 0.95
parameters::model_parameters(res)
#> # Random Effects
#>
#> Parameter         | Coefficient |   SE |         95% CI |      z |      p | Weight
#> ----------------------------------------------------------------------------------
#> Aronson           |       -0.89 | 0.57 | [-2.01,  0.23] |  -1.56 | 0.119  |   3.07
#> Ferguson & Simes  |       -1.59 | 0.44 | [-2.45, -0.72] |  -3.59 | < .001 |   5.14
#> Rosenthal et al.1 |       -1.35 | 0.64 | [-2.61, -0.08] |  -2.09 | 0.036  |   2.41
#> Hart & Sutherland |       -1.44 | 0.14 | [-1.72, -1.16] | -10.19 | < .001 |  49.97
#> Vandiviere et al  |       -1.62 | 0.47 | [-2.55, -0.70] |  -3.43 | < .001 |   4.48
#> TPT Madras        |        0.01 | 0.06 | [-0.11,  0.14] |   0.19 | 0.849  | 252.42
#> Coetzee & Berjak  |       -0.47 | 0.24 | [-0.94,  0.00] |  -1.98 | 0.048  |  17.72
#> Overall           |       -0.45 | 0.52 | [-1.46,  0.56] |  -0.87 | 0.385  |
#>
#> # alternate
#>
#> Parameter            | Coefficient |   SE |         95% CI |     z |      p | Weight
#> ------------------------------------------------------------------------------------
#> Frimodt-Moller et al |       -0.22 | 0.23 | [-0.66,  0.23] | -0.96 | 0.336  |  19.53
#> Stein & Aronson      |       -0.79 | 0.08 | [-0.95, -0.62] | -9.46 | < .001 | 144.81
#> Overall              |       -0.52 | 0.44 | [-1.38,  0.35] | -1.17 | 0.240  |
#>
#> # systematic
#>
#> Parameter          | Coefficient |   SE |         95% CI |     z |      p | Weight
#> ----------------------------------------------------------------------------------
#> Rosenthal et al.2  |       -1.37 | 0.27 | [-1.90, -0.84] | -5.07 | < .001 |  13.69
#> Comstock et al.1   |       -0.34 | 0.11 | [-0.56, -0.12] | -3.05 | 0.002  |  80.57
#> Comstock & Webster |        0.45 | 0.73 | [-0.98,  1.88] |  0.61 | 0.541  |   1.88
#> Comstock et al.2   |       -0.02 | 0.27 | [-0.54,  0.51] | -0.06 | 0.948  |  14.00
#> Overall            |        0.09 | 0.56 | [-1.01,  1.19] |  0.16 | 0.874  |
#>
#> Uncertainty intervals (equal-tailed) and p-values (two-tailed) computed
#>   using a Wald z-distribution approximation.
sessionInfo()
#> R version 4.2.1 (2022-06-23)
#> Platform: x86_64-apple-darwin17.0 (64-bit)
#> Running under: macOS Catalina 10.15.7
#>
#> Matrix products: default
#> BLAS:   /Library/Frameworks/R.framework/Versions/4.2/Resources/lib/libRblas.0.dylib
#> LAPACK: /Library/Frameworks/R.framework/Versions/4.2/Resources/lib/libRlapack.dylib
#>
#> locale:
#> [1] en_US.UTF-8/en_US.UTF-8/en_US.UTF-8/C/en_US.UTF-8/en_US.UTF-8
#>
#> attached base packages:
#> [1] stats     graphics  grDevices utils     datasets  methods   base
#>
#> other attached packages:
#> [1] parameters_0.18.2 emmeans_1.8.0     metafor_3.9-5     metadat_1.2-0
#> [5] Matrix_1.4-1
#>
#> loaded via a namespace (and not attached):
#>  [1] rstudioapi_0.14    knitr_1.40         mathjaxr_1.6-0     magrittr_2.0.3
#>  [5] insight_0.18.2     xtable_1.8-4       lattice_0.20-45    rlang_1.0.4
#>  [9] fastmap_1.1.0      stringr_1.4.1      tools_4.2.1        grid_4.2.1
#> [13] nlme_3.1-157       xfun_0.32          coda_0.19-4        cli_3.3.0
#> [17] bayestestR_0.12.1  withr_2.5.0        htmltools_0.5.3    datawizard_0.5.1
#> [21] yaml_2.3.5         digest_0.6.29      lifecycle_1.0.1    fs_1.5.2
#> [25] glue_1.6.2         evaluate_0.16      rmarkdown_2.16     reprex_2.0.2
#> [29] stringi_1.7.8      estimability_1.4.1 compiler_4.2.1     mvtnorm_1.1-3
Created on 2022-09-03 with reprex v2.0.2
model_parameters() does not report predictions (that should be in the modelbased package, but I guess not implemented yet). It reports the estimates, SE etc. from the summary. See:
library(metafor)
#> Loading required package: Matrix
#> Loading required package: metadat
#>
#> Loading the 'metafor' package (version 3.8-1). For an
#> introduction to the package please type: help(metafor)
library(parameters)

dat <- metadat::dat.bcg

datRR <- metafor::escalc(measure="RR",
                         data=dat,
                         ai=tpos, bi=tneg, ci=cpos, di=cneg)

res <- metafor::rma(data=datRR,
                         method = "REML",
                         mods = ~ alloc,
                         yi = yi, vi = vi,
                         slab = author)

summary(res)
#>
#> Mixed-Effects Model (k = 13; tau^2 estimator: REML)
#>
#>   logLik  deviance       AIC       BIC      AICc
#> -10.3301   20.6602   28.6602   29.8705   36.6602
#>
#> tau^2 (estimated amount of residual heterogeneity):     0.3615 (SE = 0.2111)
#> tau (square root of estimated tau^2 value):             0.6013
#> I^2 (residual heterogeneity / unaccounted variability): 88.77%
#> H^2 (unaccounted variability / sampling variability):   8.91
#> R^2 (amount of heterogeneity accounted for):            0.00%
#>
#> Test for Residual Heterogeneity:
#> QE(df = 10) = 132.3676, p-val < .0001
#>
#> Test of Moderators (coefficients 2:3):
#> QM(df = 2) = 1.7675, p-val = 0.4132
#>
#> Model Results:
#>
#>                  estimate      se     zval    pval    ci.lb   ci.ub
#> intrcpt           -0.5180  0.4412  -1.1740  0.2404  -1.3827  0.3468
#> allocrandom       -0.4478  0.5158  -0.8682  0.3853  -1.4588  0.5632
#> allocsystematic    0.0890  0.5600   0.1590  0.8737  -1.0086  1.1867
#>
#> ---
#> Signif. codes:  0 '***' 0.001 '**' 0.01 '*' 0.05 '.' 0.1 ' ' 1
model_parameters(res)
#> # Random Effects
#>
#> Parameter         | Coefficient |   SE |         95% CI |      z |      p | Weight
#> ----------------------------------------------------------------------------------
#> Aronson           |       -0.89 | 0.57 | [-2.01,  0.23] |  -1.56 | 0.119  |   3.07
#> Ferguson & Simes  |       -1.59 | 0.44 | [-2.45, -0.72] |  -3.59 | < .001 |   5.14
#> Rosenthal et al.1 |       -1.35 | 0.64 | [-2.61, -0.08] |  -2.09 | 0.036  |   2.41
#> Hart & Sutherland |       -1.44 | 0.14 | [-1.72, -1.16] | -10.19 | < .001 |  49.97
#> Vandiviere et al  |       -1.62 | 0.47 | [-2.55, -0.70] |  -3.43 | < .001 |   4.48
#> TPT Madras        |        0.01 | 0.06 | [-0.11,  0.14] |   0.19 | 0.849  | 252.42
#> Coetzee & Berjak  |       -0.47 | 0.24 | [-0.94,  0.00] |  -1.98 | 0.048  |  17.72
#> Overall           |       -0.45 | 0.52 | [-1.46,  0.56] |  -0.87 | 0.385  |
#>
#> # alternate
#>
#> Parameter            | Coefficient |   SE |         95% CI |     z |      p | Weight
#> ------------------------------------------------------------------------------------
#> Frimodt-Moller et al |       -0.22 | 0.23 | [-0.66,  0.23] | -0.96 | 0.336  |  19.53
#> Stein & Aronson      |       -0.79 | 0.08 | [-0.95, -0.62] | -9.46 | < .001 | 144.81
#> Overall              |       -0.52 | 0.44 | [-1.38,  0.35] | -1.17 | 0.240  |
#>
#> # systematic
#>
#> Parameter          | Coefficient |   SE |         95% CI |     z |      p | Weight
#> ----------------------------------------------------------------------------------
#> Rosenthal et al.2  |       -1.37 | 0.27 | [-1.90, -0.84] | -5.07 | < .001 |  13.69
#> Comstock et al.1   |       -0.34 | 0.11 | [-0.56, -0.12] | -3.05 | 0.002  |  80.57
#> Comstock & Webster |        0.45 | 0.73 | [-0.98,  1.88] |  0.61 | 0.541  |   1.88
#> Comstock et al.2   |       -0.02 | 0.27 | [-0.54,  0.51] | -0.06 | 0.948  |  14.00
#> Overall            |        0.09 | 0.56 | [-1.01,  1.19] |  0.16 | 0.874  |
#>
#> Uncertainty intervals (equal-tailed) and p-values (two-tailed) computed
#>   using a Wald z-distribution approximation.
Created on 2022-09-03 with reprex v2.0.2
The "Overall" rows correspond to the three estimates from the summary.
I see, thank you for the quick reply!
I don't think that users expect to get results from summary(), especially not when plotting results with see.
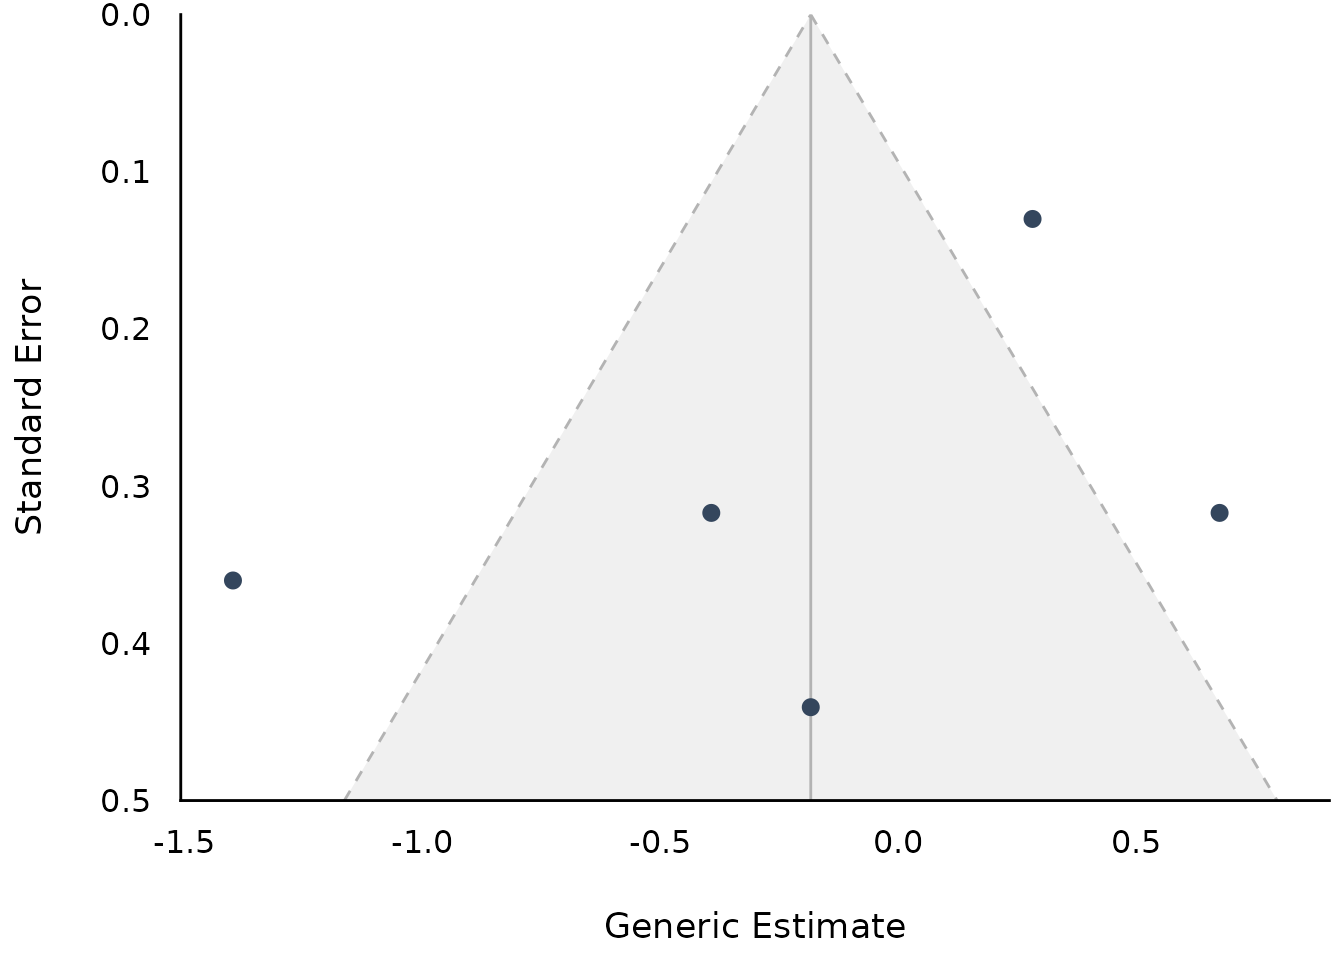
Don't you agree this forest plot looks odd by depicting coefficients, instead of predictions by subgroup?
Well, it's similar to forestplot():
library(metafor)
#> Loading required package: Matrix
#> Loading required package: metadat
#>
#> Loading the 'metafor' package (version 3.8-1). For an
#> introduction to the package please type: help(metafor)
library(parameters)

dat <- metadat::dat.bcg

datRR <- metafor::escalc(measure="RR",
                         data=dat,
                         ai=tpos, bi=tneg, ci=cpos, di=cneg)

res <- metafor::rma(data=datRR,
                         method = "REML",
                         mods = ~ alloc,
                         yi = yi, vi = vi,
                         slab = author)

model_parameters(res) |> plot(show_labels = TRUE)

forest(res)

Created on 2022-09-03 with reprex v2.0.2
metafor is an excellent package, but there isn't a built-in easy way to plot results from subgroups.
By contrast, the R package meta has a nice forest() function that quickly plots by subgroup:

I think parameters/see could fill this gap in metafor's functionalities by showing model predictions instead of summary results.
What do you think?
I'd say we should have both. But this would indeed be something for modelbased.
@bwiernik @DominiqueMakowski just to let you know. I don't know how to implement a predict-method for rma, there's also a years-old issue for ggeffects: https://github.com/strengejacke/ggeffects/issues/30
Perhaps the new function metafor::emmprep can help. Its features were described by @wviechtb in this thread.
I have work in progress on improving support for metafor in easystats: https://github.com/easystats/insight/pull/514
Should we have insight::get_predicted.rma? (I know nothing about these models, so I probably can't help. Sorry.)
The major headache currently is that metafor doesn't currently accept data frames as input in its predict method. https://github.com/wviechtb/metafor/issues/48
Should we have
insight::get_predicted.rma? (I know nothing about these models, so I probably can't help. Sorry.)
That's the PR I link above
How can we work on that PR? The branch isn't published, and I cannot pull?
Nothing special about it? What happens when you try to checkout origin/metafor?
It says I need to fetch, but I can't because the branch isn't published. When I want to publish, it says I can't because I need to fetch latest files. Doesn't work from within vscode nor GitHub desktop app.
I'm not sure what that means because the branch is definitely published. I'll take a look when I am at a computer