correlation
 correlation copied to clipboard
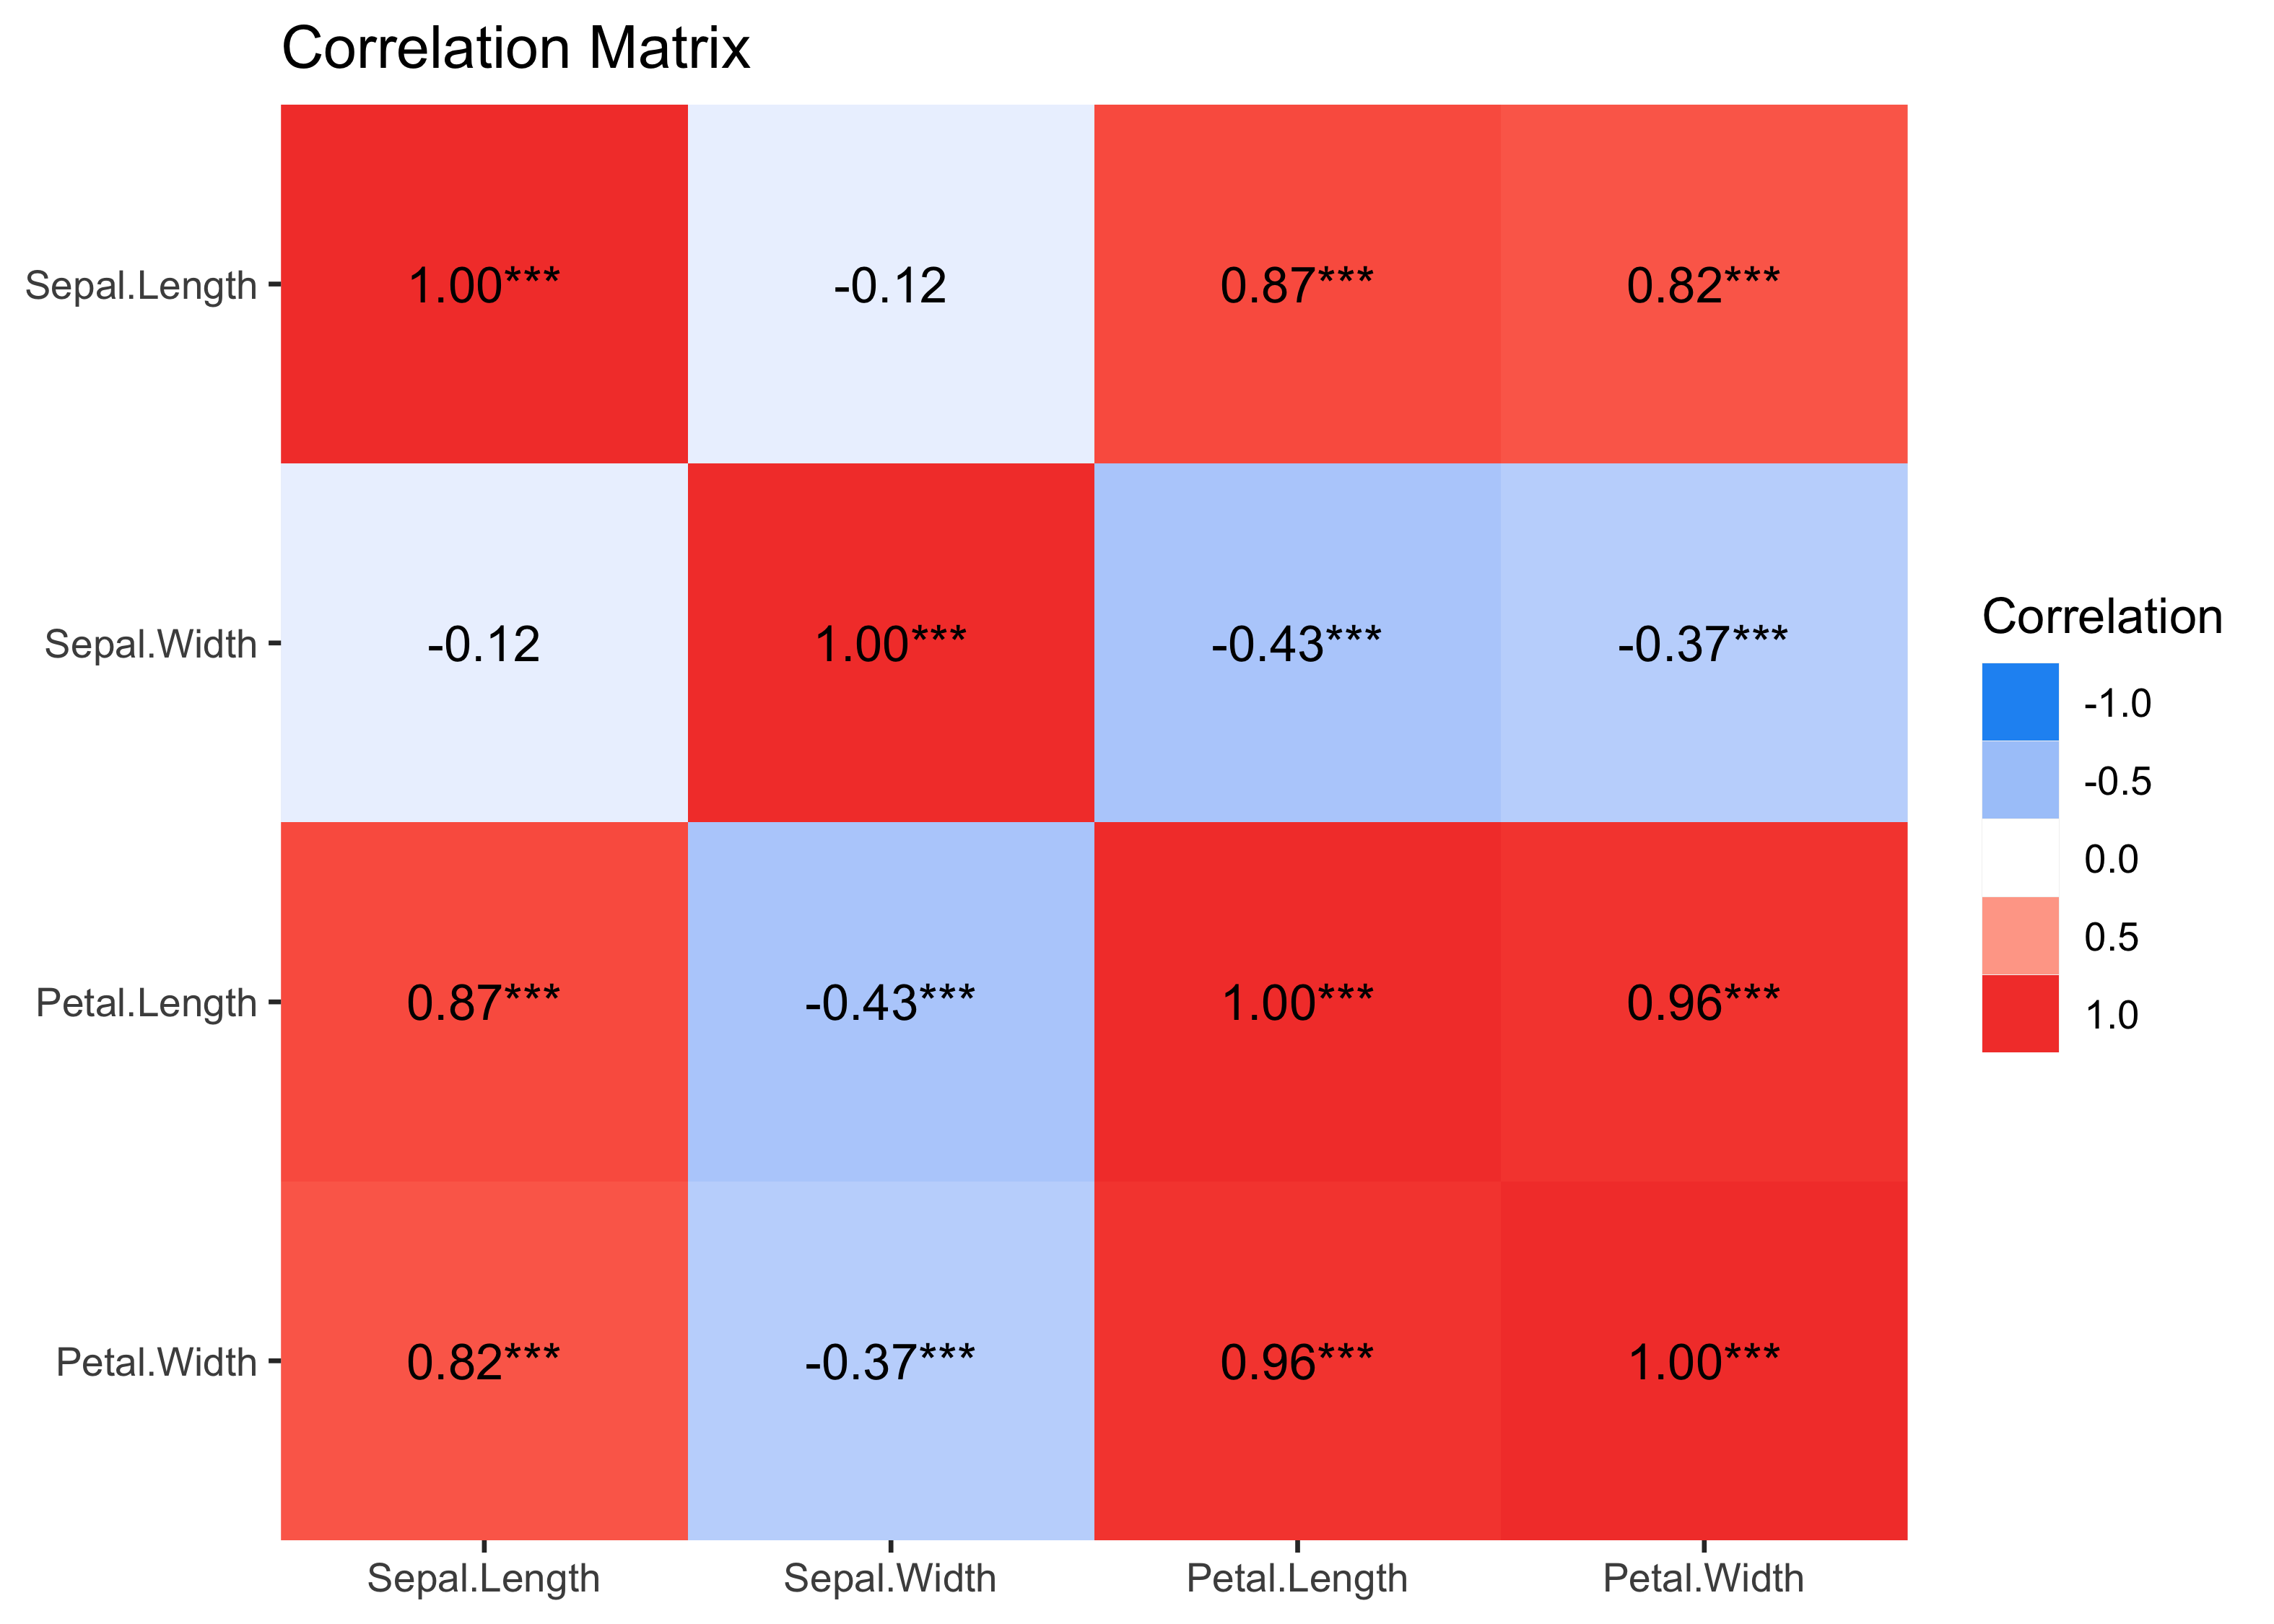
Should not use *** for self-correlations R(x,x)=1
I'm not a fan of significance stars, but certainly in text output and plots, you should not use *** for the self-correlations r(x,x)=1
Thanks for your feedback!
Yes, I agree that this should not be the case.
For plots:
or for text outputs:
## # Correlation Matrix (pearson-method)
##
## Parameter    | Sepal.Length | Sepal.Width | Petal.Length | Petal.Width
## ----------------------------------------------------------------------
## Sepal.Length |      1.00*** |       -0.12 |      0.87*** |     0.82***
## Sepal.Width  |        -0.12 |     1.00*** |     -0.43*** |    -0.37***
## Petal.Length |      0.87*** |    -0.43*** |      1.00*** |     0.96***
## Petal.Width  |      0.82*** |    -0.37*** |      0.96*** |     1.00***
##
## p-value adjustment method: Holm (1979)
Agreed. Should also change coloring of the diagonal to not be solid and dark.
What do folks think about changing the defaults to omit stars?
YES to (light) grey. Try this to see what a difference it makes to perception.
library(correlation)
x <- correlation(iris)
s <- summary(x, redundant = TRUE)
plot(s)

Created on 2022-08-19 by the reprex package (v2.0.1)
Plot ok like this, or any suggestions for changes?
Same for print now:
library(correlation)
x <- correlation(iris)
summary(x, redundant = TRUE)
#> # Correlation Matrix (pearson-method)
#>
#> Parameter    | Sepal.Length | Sepal.Width | Petal.Length | Petal.Width
#> ----------------------------------------------------------------------
#> Sepal.Length |              |       -0.12 |      0.87*** |     0.82***
#> Sepal.Width  |        -0.12 |             |     -0.43*** |    -0.37***
#> Petal.Length |      0.87*** |    -0.43*** |              |     0.96***
#> Petal.Width  |      0.82*** |    -0.37*** |      0.96*** |
#>
#> p-value adjustment method: Holm (1979)
Created on 2022-08-19 by the reprex package (v2.0.1)
isn't showing stars a feature that people are looking for? (and thus could help for the visibility of the package, then it' easy to turn them off)
IIRC correctly, plot.summary() and print.summary() don't have any argument to disable stars or to show intervals. I personally think they should be non-default