diagnostics
 diagnostics copied to clipboard
RelatedActivityIds not being collected when using dotnet-trace
There seems to be an issue with dotnet-trace where RelatedActivityIds are not collected, at least not for the provider Microsoft-Diagnostics-DiagnosticSource. In order to demonstrate what the events should look like I've also included instructions in the repro steps on how to collect a diagsession with the same events where the only difference in collection is that the diagsession collects using ETW (using DiagnosticSourceEventSource to forward the DiagnosticSource events from EventPipe) instead of dotnet-trace:
- Attach to a .NET Core application (I've been using .NET Core version 3.1.300-preview-015135 for reference) that uses EF Core with a non in-memory database (I can provide an example application via email if needed) using dotnet-trace with the following command:
dotnet-trace collect -p <PID> --providers Microsoft-Diagnostics-DiagnosticSource:00000003:5:FilterAndPayloadSpecs=\"Microsoft.EntityFrameworkCore/Microsoft.EntityFrameworkCore.Database.Transaction.TransactionStarting@Activity1Start:-TransactionId;IsAsync\r\nMicrosoft.EntityFrameworkCore/Microsoft.EntityFrameworkCore.Database.Transaction.TransactionCommitted@Activity1Stop:\r\nMicrosoft.EntityFrameworkCore/Microsoft.EntityFrameworkCore.Database.Transaction.TransactionRolledBack@Activity1Stop:\r\nMicrosoft.EntityFrameworkCore/Microsoft.EntityFrameworkCore.Database.Transaction.TransactionDisposed@Activity1Stop:-TransactionId\r\nMicrosoft.EntityFrameworkCore/Microsoft.EntityFrameworkCore.Database.Command.CommandExecuting@Activity2Start:-Command;Command.CommandText;ConnectionId;IsAsync;Command.Connection.ClientConnectionId;Command.Connection.ServerVersion;Command.CommandTimeout;Command.CommandType;Command.Connection.ConnectionString;Command.Connection.Database;Command.Connection.DataSource;Command.Connection.PacketSize\r\nMicrosoft.EntityFrameworkCore/Microsoft.EntityFrameworkCore.Database.Command.DataReaderDisposing@Activity2Stop:-CommandId;RecordsAffected;ReadCount\r\nMicrosoft.EntityFrameworkCore/Microsoft.EntityFrameworkCore.Database.Command.CommandError@Activity2Stop:-Exception\r\nSqlClientDiagnosticListener/System.Data.SqlClient.WriteCommandBefore:-OperationId;Command;Command.CommandText;ConnectionId;Operation;Command.Connection.ServerVersion;Command.CommandTimeout;Command.CommandType;Command.Connection.ConnectionString;Command.Connection.Database;Command.Connection.DataSource\r\nSqlClientDiagnosticListener/System.Data.SqlClient.WriteCommandAfter:-OperationId\r\nSqlClientDiagnosticListener/System.Data.SqlClient.WriteCommandError:-OperationId;Exception\r\nSqlClientDiagnosticListener/Microsoft.Data.SqlClient.WriteCommandBefore:-OperationId;Command;Command.CommandText;ConnectionId;Operation;Command.Connection.ServerVersion;Command.CommandTimeout;Command.CommandType;Command.Connection.ConnectionString;Command.Connection.Database;Command.Connection.DataSource\r\nSqlClientDiagnosticListener/Microsoft.Data.SqlClient.WriteCommandAfter:-OperationId\r\nSqlClientDiagnosticListener/Microsoft.Data.SqlClient.WriteCommandError:-OperationId;Exception\",System.Threading.Tasks.TplEventSource
-
Open the nettrace in perfview
-
Note how there are no related activity ids for Microsoft-Diagnostics-DiagnosticSource/Activity2Start/Start events

-
Now using the same .NET Core application, profile the application using the database tool in Visual Studio 2019 (Debug -> Performance Profiler -> Database)
-
Save the resulting diagsession and open it in perfview
-
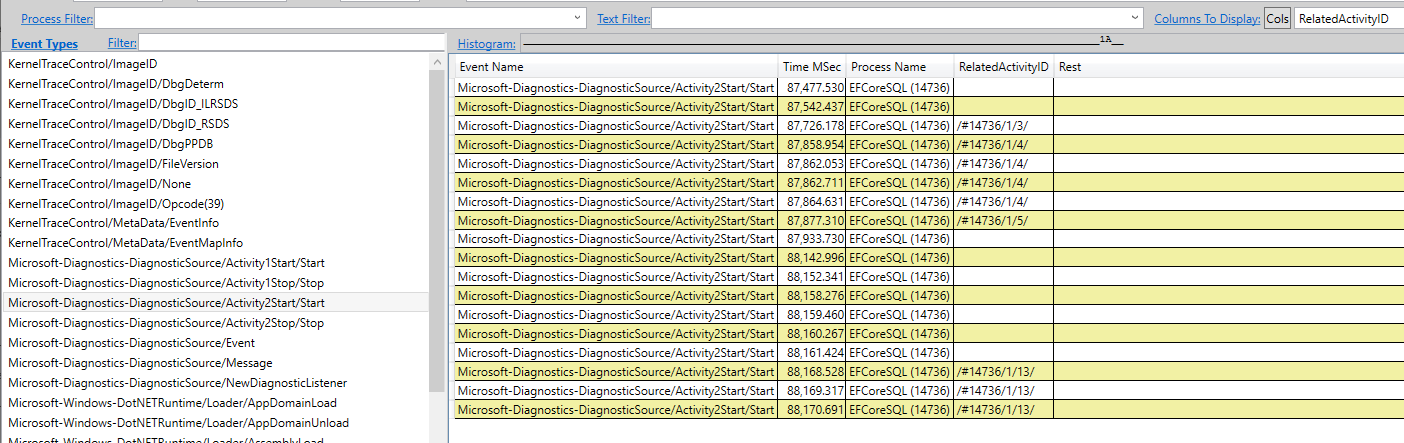
Note how all the events and the information for them are almost the same except that this time there are RelatedActivityIds for Microsoft-Diagnostics-DiagnosticSource/Activity2Start/Start events:
For reference when collecting with dotnet-trace you will need to use an older version of dotnet-trace (I used 3.1.57502+6767a9ac24bde3a58d7b51bdaff7c7d75aab9a65) to collect Microsoft-Diagnostics-DiagnosticSource events due to this bug: #1190
Also for additional context this bug prevents the Visual Studio Performance Profiler's database tool from providing information about database transactions when collecting with dotnet-trace which we need in order to suppot Linux (since we rely on dotnet-trace for collection on Linux).
@josalem if you don't mind, I can tackle this one since I've been spending the past few days investigating related issues.
Sorry for the late update here but I've investigated this issue and root-caused it to a TraceEvent issue. I will be following up with a PR to address this after I bounce off some ideas about the fix with Brian Robbins.