[Feature Suggestion] Adding manual instrumentation to profile and understand DirectX to Vulkan mappings
Hey DXVK team,
We are a team at Google working on the open source Orbit profiler (github.com/google/orbit) and we are interested in adding instrumentation markers into DXVK that aid our users in understanding mapping DirectX calls to Vulkan. While we are interested in using these markers in Orbit and using our own API (https://github.com/google/orbit/blob/main/src/ApiInterface/include/ApiInterface/Orbit.h), we would add this in DXVK in an instrumentation API agnostic way.
Here’s an example of what this would look like:
void DXVKFunction() {
    // Used to group together Dx calls and their emitted callbacks.
    uint64_t group_id;
    // Automatically picks up the function name as scope name.
    DXVK_PROFILING_MARKER_FUNCTION_SCOPE(Color(1.0, 0, 0, 1.0), &group_id);

    [...]

    EmitCs([[...], group_id](DxvkContext* ctx) {
      DXVK_PROFILING_MARKER_SCOPE(“marker_name”, Color(1.0, 0, 0, 1.0), group_id);
      [...]
    });

    [...]
}
Specializing this to the Orbit API can then be done in an isolated way, and could look like something along those lines:
// ProfilingSupport.cpp

#include “Orbit.h”
ORBIT_API_INSTANTIATE

// Used to group together Dx calls and their emitted callbacks.
extern std::atomic<uint64_t> kOrbitPortoGlobalGroupId;

#define DXVK_PROFILING_MARKER_FUNCTION_SCOPE(color_rgba, group_id)                   \
    *group_id = kOrbitPortoGlobalGroupId++;                                                                               \
    ORBIT_SCOPE_WITH_COLOR_AND_GROUP_ID(__FUNCTION__, color_rgba, group_id);

#define DXVK_PROFILING_MARKER_SCOPE(label, color_rgba, group_id)           \
    ORBIT_SCOPE_WITH_COLOR_AND_GROUP_ID(label, color_rgba, group_id);
This can also aid other profilers with instrumentation APIs such as VTune, or Tracy Profiler (some care needs to be taken to make the DXVK API generic to support all profilers).
If you think this is all a great idea, we’d be happy to create a pull request and we can discuss details (if any) there.
We would also be interested in adding Vulkan debug labels (using the Debug utils extension), but that’s a topic to discuss later. However, here is already how we are thinking of this:
void cmdVulkanFunction() {
    DXVK_PROFILING_MARKER_FUNCTION_SCOPE(Color(1.0, 0, 0, 1.0), group_id);
    DXVK_PROFILING_VK_BEGIN_DEBUG_LABEL_FUNCTION(m_execBuffer, &group_id);

    m_vkd->vkCmdVulkanFunction(m_execBuffer, [...]);

    DXVK_PROFILING_VK_END_DEBUG_LABEL(m_execBuffer, &group_id);
}
Hi,
How is this advantageous compared to just using perf? Can you give some examples?
We use lambda functions everywhere for emitting CS which has the parent function in the symbol name which makes perf hotspots on CS fairly easy to backtrace.
As for the GPU side, I agree, but I would rather just have some class that pushes and pops a debug label to automatically deal with scoping.
Hi, thanks for the quick response.
So just to check if we are speaking about the same thing. You would basically suggest to use Linux perf to sample callstacks. And when you do a hotspot analysis and find a particular emitted CS, you can easily correlate to the "parent" function. Did I get this right?
The advantages of the instrumentation are:
- it will not only give us aggregated data, but also a way to show events on a timeline;
- it will give us exact timings of the instrumented scopes, compared to the estimations we get from sampling;
- it has very low overhead when profiling.
As an example, imagine you have a particular frame (or sequence of frames) that are surprisingly slow. In a profiler (such as Orbit), you can jump to such a frame and have a detailed look with the instrumentation, to e.g.
- see if a certain call or CS takes longer than expected;
- correlate DX function calls with their CSs;
- check if there is high scheduling latency from the DX function to the execution of the CS.
So we believe this adds additional value to pure sampling, as you will be able to get more detailed insights.
Another use-case we consider is understanding the DXVK translation. When instrumenting the DX functions as well as the Vulkan functions, you'll be able to see how a certain DX function gets translated on a timeline. Again, in a series of slow frames this could help you to identify the actual issue.
We have a prototype of such an instrumentation, and here is a screenshot of how that could look like in Orbit's timeline.
You can click on the scope of a DrawPrimitive call and see the corresponding CS on the other thread.

A similar analysis could be then made on the Vulkan functions (like in this screenshot):
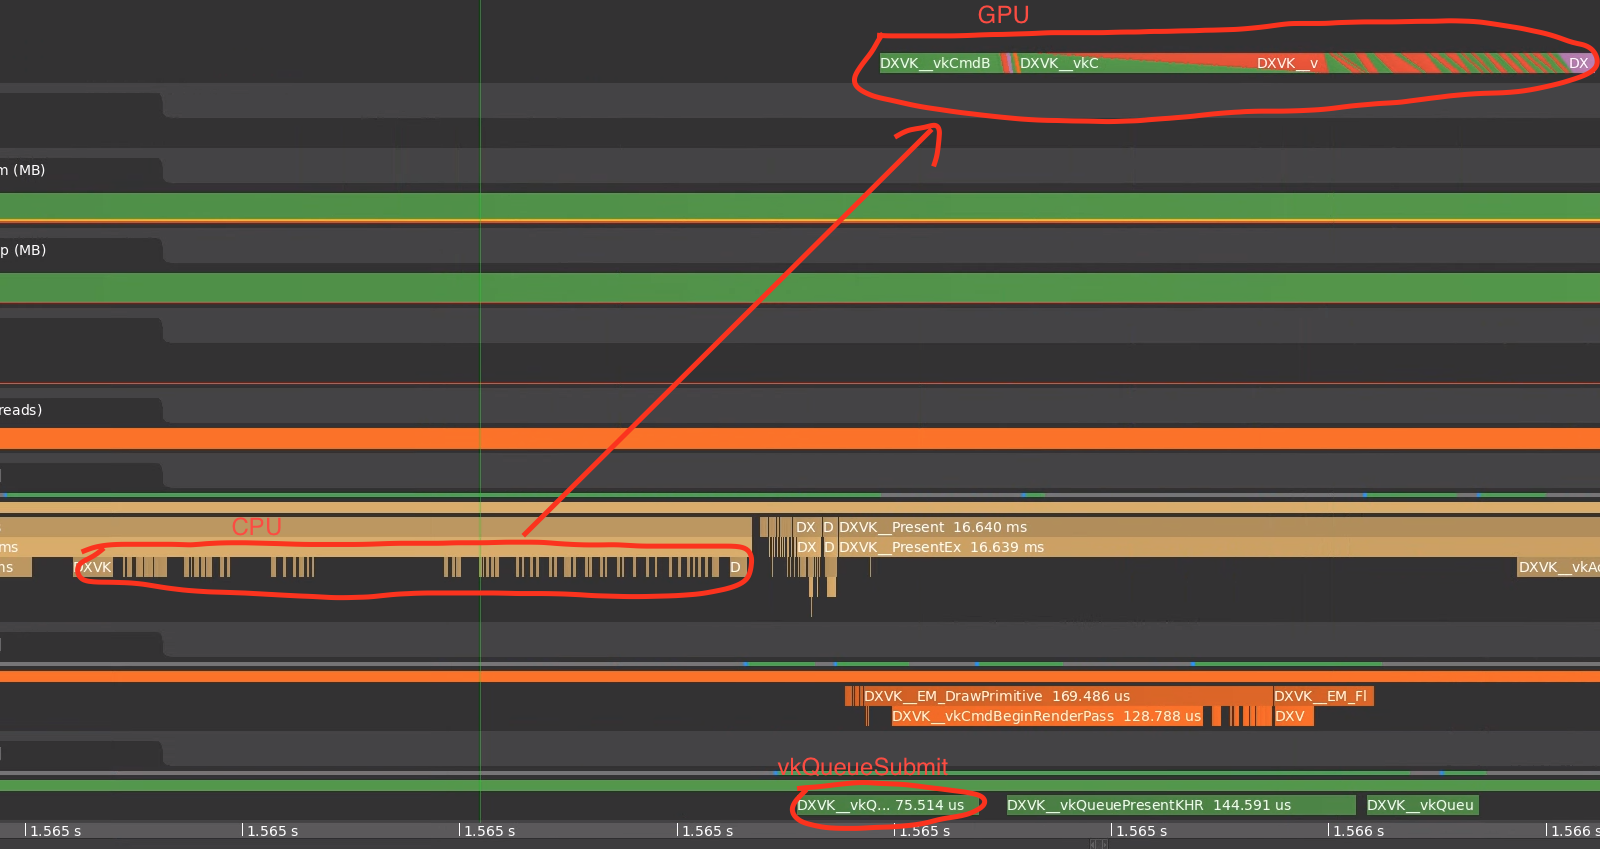
Regarding the GPU side. Yeah, I agree a class to handle the scoping (similar to the proposal on the CPU instrumentation, and how we did this in Orbit) would be the way to go.
So just to check if we are speaking about the same thing. You would basically suggest to use Linux perf to sample callstacks. And when you do a hotspot analysis and find a particular emitted CS, you can easily correlate to the "parent" function. Did I get this right?
Yes, it shows up as, eg:
dxvk::D3D9DeviceEx::BindInputLayout()::{lambda(dxvk::DxvkContext*)#2}::operator()
    12.36%     0.00%  portal2_linux    libpthread-2.33.so          [.] start_thread
            |
            ---start_thread
               |
                --12.27%--execute_native_thread_routine
                          |
                          |--8.44%--std::thread::_State_impl<std::thread::_Invoker<std::tuple<dxvk::DxvkCsThread::DxvkCsThread(dxvk::Rc<dxvk::DxvkContext> const&)::{lambda()#1}> > >::_M_run
                          |          std::thread::_Invoker<std::tuple<dxvk::DxvkCsThread::DxvkCsThread(dxvk::Rc<dxvk::DxvkContext> const&)::{lambda()#1}> >::operator()
                          |          std::thread::_Invoker<std::tuple<dxvk::DxvkCsThread::DxvkCsThread(dxvk::Rc<dxvk::DxvkContext> const&)::{lambda()#1}> >::_M_invoke<0u>
                          |          std::__invoke<dxvk::DxvkCsThread::DxvkCsThread(dxvk::Rc<dxvk::DxvkContext> const&)::{lambda()#1}>
                          |          std::__invoke_impl<void, dxvk::DxvkCsThread::DxvkCsThread(dxvk::Rc<dxvk::DxvkContext> const&)::{lambda()#1}>
                          |          dxvk::DxvkCsThread::DxvkCsThread(dxvk::Rc<dxvk::DxvkContext> const&)::{lambda()#1}::operator()
                          |          |
                          |           --8.27%--dxvk::DxvkCsThread::threadFunc
                          |                     |
                          |                      --7.54%--dxvk::DxvkCsChunk::executeAll
                          |                                |
                          |                                |--2.78%--dxvk::DxvkCsTypedCmd<dxvk::D3D9DeviceEx::DrawIndexedPrimitive(_D3DPRIMITIVETYPE, int, unsigned int, unsigned int, unsigned int, unsigned int)::{lambda(dxvk:>
                          |                                |          |
                          |                                |           --2.76%--dxvk::D3D9DeviceEx::DrawIndexedPrimitive(_D3DPRIMITIVETYPE, int, unsigned int, unsigned int, unsigned int, unsigned int)::{lambda(dxvk::DxvkConte>
                          |                                |                     |
                          |                                |                      --2.73%--dxvk::DxvkContext::drawIndexed
                          |                                |                                |
                          |                                |                                 --2.65%--dxvk::DxvkContext::commitGraphicsState<true, false>
                          |                                |                                           |
                          |                                |                                           |--0.79%--dxvk::DxvkContext::updateFramebuffer
                          |                                |                                           |
                          |                                |                                            --0.58%--dxvk::DxvkContext::updateGraphicsShaderResources
                          |                                |
                          |                                |--1.13%--dxvk::DxvkCsTypedCmd<dxvk::D3D9SwapChainEx::SubmitPresent(dxvk::vk::PresenterSync const&, unsigned int)::{lambda(dxvk::DxvkContext*)#1}>::exec
                          |                                |          |
                          |                                |           --1.05%--dxvk::D3D9SwapChainEx::SubmitPresent(dxvk::vk::PresenterSync const&, unsigned int)::{lambda(dxvk::DxvkContext*)#1}::operator()
                          |                                |                     |
                          |                                |                      --0.60%--dxvk::hud::Hud::update
                          |                                |                                |
                          |                                |                                 --0.59%--dxvk::hud::HudItemSet::update
                          |                                |
                          |                                 --0.52%--dxvk::DxvkCsTypedCmd<dxvk::D3D9DeviceEx::Flush()::{lambda(dxvk::DxvkContext*)#1}>::exec
                          |                                           |
                          |                                            --0.51%--dxvk::D3D9DeviceEx::Flush()::{lambda(dxvk::DxvkContext*)#1}::operator()
We also have gpuvis integration with perf so you can see it on the timeline along side gpu events, although I don't think that does full call stacks yet.
Not trying to shoot this down fwiw, just trying to explain what I have been doing so far for perf debugging. Having more perf tooling is always good, we just haven't had a need ourselves so far.
I guess it also makes sense to have a non-sampling profiler to help track contention and sleepy times too.
Thanks for the example, and sorry for my late response.
I agree that sampling is a pretty powerful technique for profiling.
But as said, we believe there is a lot of additional value in instrumentation. In particular, for users of DXVK (who might not know the code in detail). For a particular issue with a game, you might be only interested in a couple of glitchy frames. In that case, instrumentation provides a great way to actually spot the issue. It allows you to really understand what is going on in that particular situation, even when multiple threads are involved. As stated above, we actually already implemented a prototype of the instrumentation for DXVK and found it useful; assuming it might be also useful for you/your users.
I am a bit unsure how to proceed. Do you have any more questions regarding the proposal, or would you like more concrete examples for the usefulness of the instrumentation? Should I move on and create a PR for this? If needed, I should be also able to provide more insights in our prototype implementation in Orbit.
We also have gpuvis integration with perf so you can see it on the timeline alongside gpu events, although I don't think that does full call stacks yet.
May I ask, what do you exactly mean by "we gpuvis integration"? Is DXVK adjusted to work better with gpuvis? Is there some instrumentation?
In general, gpuvis also provides a lot of useful information. Especially the the Gpu queue visualization is something that we also implemented in Orbit. But those are pretty GPU focused, while our propose instrumentation (firstly) focuses on the CPU side of the DirectX to Vulkan translation.
I guess the real question is how to implement instrumentation in a way that a) doesn't add any significant maintenance cost for us and doesn't lead to us accidentally breaking use cases that we can't test, and b) doesn't turn our code into an even more hard-to-read mess than it already is.
In general I'm rather reserved about invasive changes, and would only like to add this if absolutely necessary, especially since the tools that Josh mentioned have been sufficient for our own development workflow.
For sure this depends a bit on the actual implementation.
I would not expect significant additional maintenance cost. The instrumentation would be added to the D3D API functions as well as the functions that emit CSs only. I would not expect them to change often.
For readability, this depends on the reader, I guess. It certainly will add a macro invocation at function/lambda begins.
Hi Florian/folks,
Do we have any updates on this new feature? Or does Orbit already support this with a specific DXVK fork? We are also really interested in this profiling feature so that we could understand the D3D to Vulcan translations in a timeline view, i.e. we have use cases in trying to break down game stutters and deep diving into the CPU side activities. Thanks!
Hi @Colearo,
I don't there is an update on the official side here.
Orbit does support the necessary instrumentation (matching scopes from function and emitted CS + Vulkan debug markers). We had an internal fork of DXVK with the instrumentation applied.
However, our internal version is out-of-date, and at least an easy cherry-pick of the instrumentation commits was not possible. I'll try my best to publish a fork of DXVK with some instrumentation within the next days (can't promise on anything here). This version will likely be incomplete, as quite some functions have changed and it is easy to miss something.
From my experience with the internal instrumentation, I would however, advice to agree on something upstream, or completely rethink the approach and e.g. use with the current dynamic instrumentation from Orbit (with the limitation of not easily matching functions and emitted CSs, and with missing Vulkan instrumentation). While maintaining the instrumentation might be already hard, if it is upstream, it becomes a nightmare if you want to maintain the instrumentation in a fork. Things do change quite often and drastically, so you'll quickly end up in an inconsistent state.
Anyways, I'll keep you posted.
I rebased/cherry-picked our prototype to current master branch and published it here: https://github.com/florian-kuebler/dxvk/tree/feature/orbit_instrumentation
Note, that this version is not tested. Also a couple of functions changed, so there is a good chance, that some functions are not instrumented, while others are instrumented and should not be.
Also note, that while Orbit has a Vulkan layer to track the Vulkan debug markers, this layer does not support vkQueueSubmit2, yet (whould be easy to implement), so the markers will not show up in the current version of Orbit.
Furthermore, the implementation is currently very verbose and can be simplified (e.g. by having a scope object for the Vulkan debug labels, or by de-duplicate the strings used).
So please take this version with a grain of salt, but also feel free to propose fixes/changes to that version.
Please let me know if this helps you or if you do have further questions.
Really appreciated @florian-kuebler ! I will try this and get you posted here for further questions or thoughts.