Local currency issues - y axis and toggling to USD
I'm submitting a ...
Check one of the following options with "x" and add the appropriate label to the issue as well
[x] Bug report
[ ] Regression (behaviour that used to work and stopped working in a new release)
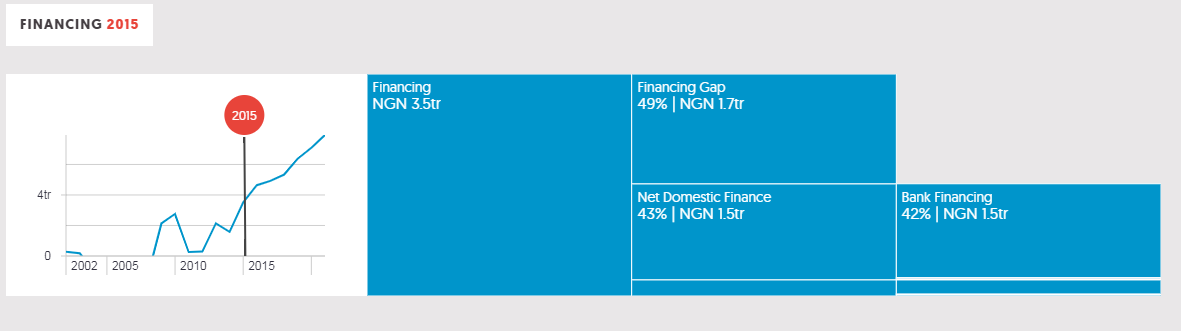
Describe the Issue The local currency charts' y axes do not drop below zero, and then when you toggle back to USD, those charts suffer from the same issue.
To Reproduce Replace the content below with the steps to reproduce the behaviour.
- Go to a country profile
- Click on the government finance charts
- Toggle between local and USD
- See error
Expected Behaviour Both types of chart's y axes are scaled to below zero, where appropriate
Screenshots/GIF
Nigeria:
Desktop (please complete the following information):
- OS: Windows 7
- Browser: Chrome
Environment/Server:
- [ ] Production
- [x] Staging
- [ ] Test
- [ ] Development
Additional Context Add any other context about the problem here.
Requested Delivery Date: 08/10/2018
This was being caused by a strange bug in the chart code. Changing the currency triggered an update in the chart (as expected), but this somehow reset the chart to some probably default configuration for the y-axis.
To fix this, I added a property that would allow the conditional recreation of the chart. The condition in this instance is the currency change. The chart is literally destroyed and recreated with the correct configuration. Ideally, there should be a plottable.js API that allows the chart configs to be updated after initial render.
Minor issue remains - USD Y axis alters slightly when toggled to after switching to local currency, changing the shape of the graph slightly
Hi @laurenceford ... couldn't replicate the issue in your last comment. Could you please get me the steps u take to replicate it.