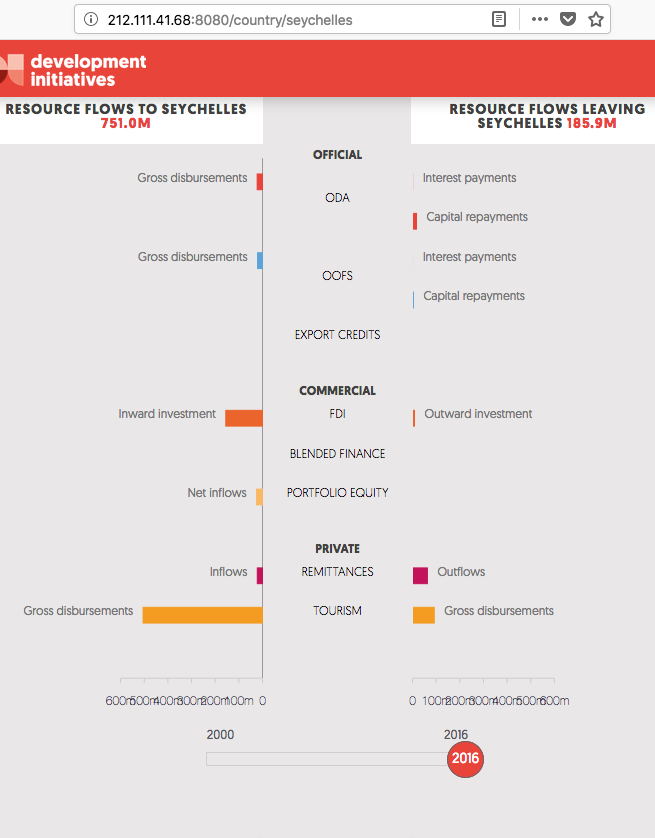
Label on graph text overlapping on smaller screen
I'm submitting a ...
Check one of the following options with "x" and add the appropriate label to the issue as well
[x ] Bug report
[ ] Regression (behaviour that used to work and stopped working in a new release)
Describe the Issue Text for the label on the bottom axis of the graph overlaps
To Reproduce Replace the content below with the steps to reproduce the behaviour.
- Go to http://data.devinit.org/country/seychelles
- Click on international resources
- Scroll down to the bottom of the first chart
- See error
Expected Behaviour fewer labels for smaller window size so they dont overlap
Screenshots/GIF
Desktop (please complete the following information):
- OS:
- Mozila
- Version [e.g. 22]
Environment/Server:
- [ x] Production
- [ x] Staging
- [ ] Test
- [ ] Development
Additional Context This is a lower priority
Requested Delivery Date: When time is available
This visualisation is generally a bit large for small devices with most of the label text going beyond bounds. Will need to figure out a different way of representing it on these devices. Stacked bar chart perhaps, with a legend? As for the legend, my idea to fix this is to reduce the number of axis points on small devices to perhaps 3.
Hi @k8hughes ... don't think I can change this easily. Would have to delve into the charts. Let me postpone this for now.