🐛[bug] Dashboard miss items.
Describe the bug
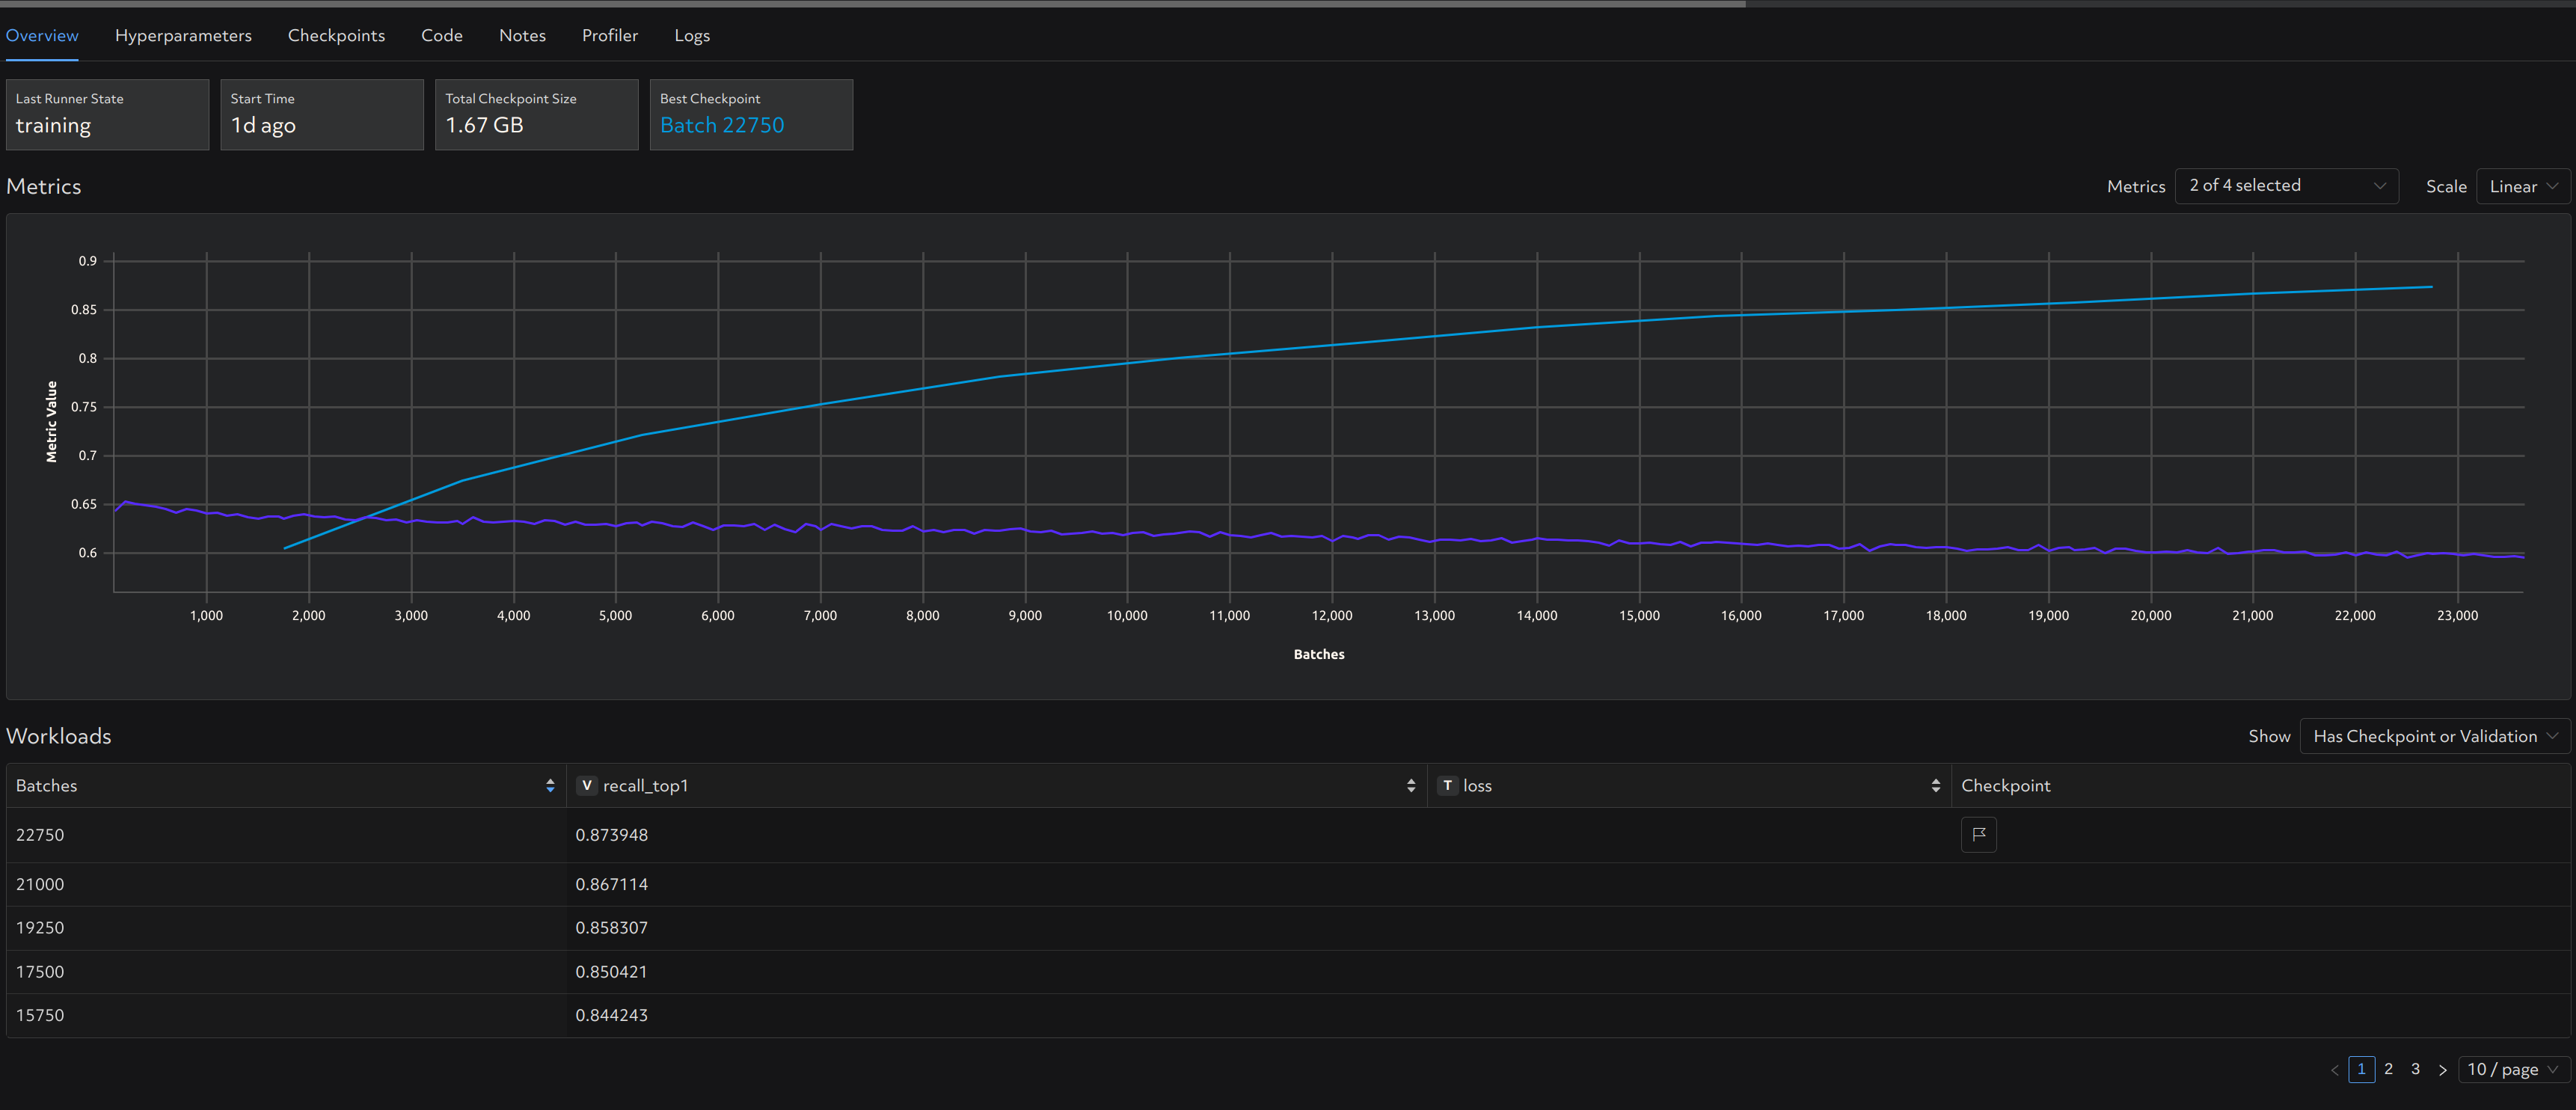
As shown in screenshot, after upgrade to 0.19.4,
- the training metrics can not be shown in the bottom table but it can be plotted on the line chart.
- even though x/page is selected, only (x/2) items are shown in the table. For example, we select 10/page, only 5 items are shown.
Reproduction Steps
Use determined 0.19.4
Expected Behavior
Show metrics as expected.
Screenshot
Environment
- Device or hardware: [Nvidia A100]
- Environment: kubernetes
Additional Context
No response
sharing this with our webui team now.
Please comment here when the fixed version is released, thanks!
the training metrics can not be shown in the bottom table but it can be plotted on the line chart.
We think this might be an issue with your table settings; can you change the dropdown above-right of the table from "Has Checkpoint or Validation" to "All", and does this help with page settings?
the training metrics can not be shown in the bottom table but it can be plotted on the line chart.
We think this might be an issue with your table settings; can you change the dropdown above-right of the table from "Has Checkpoint or Validation" to "All", and does this help with page settings?
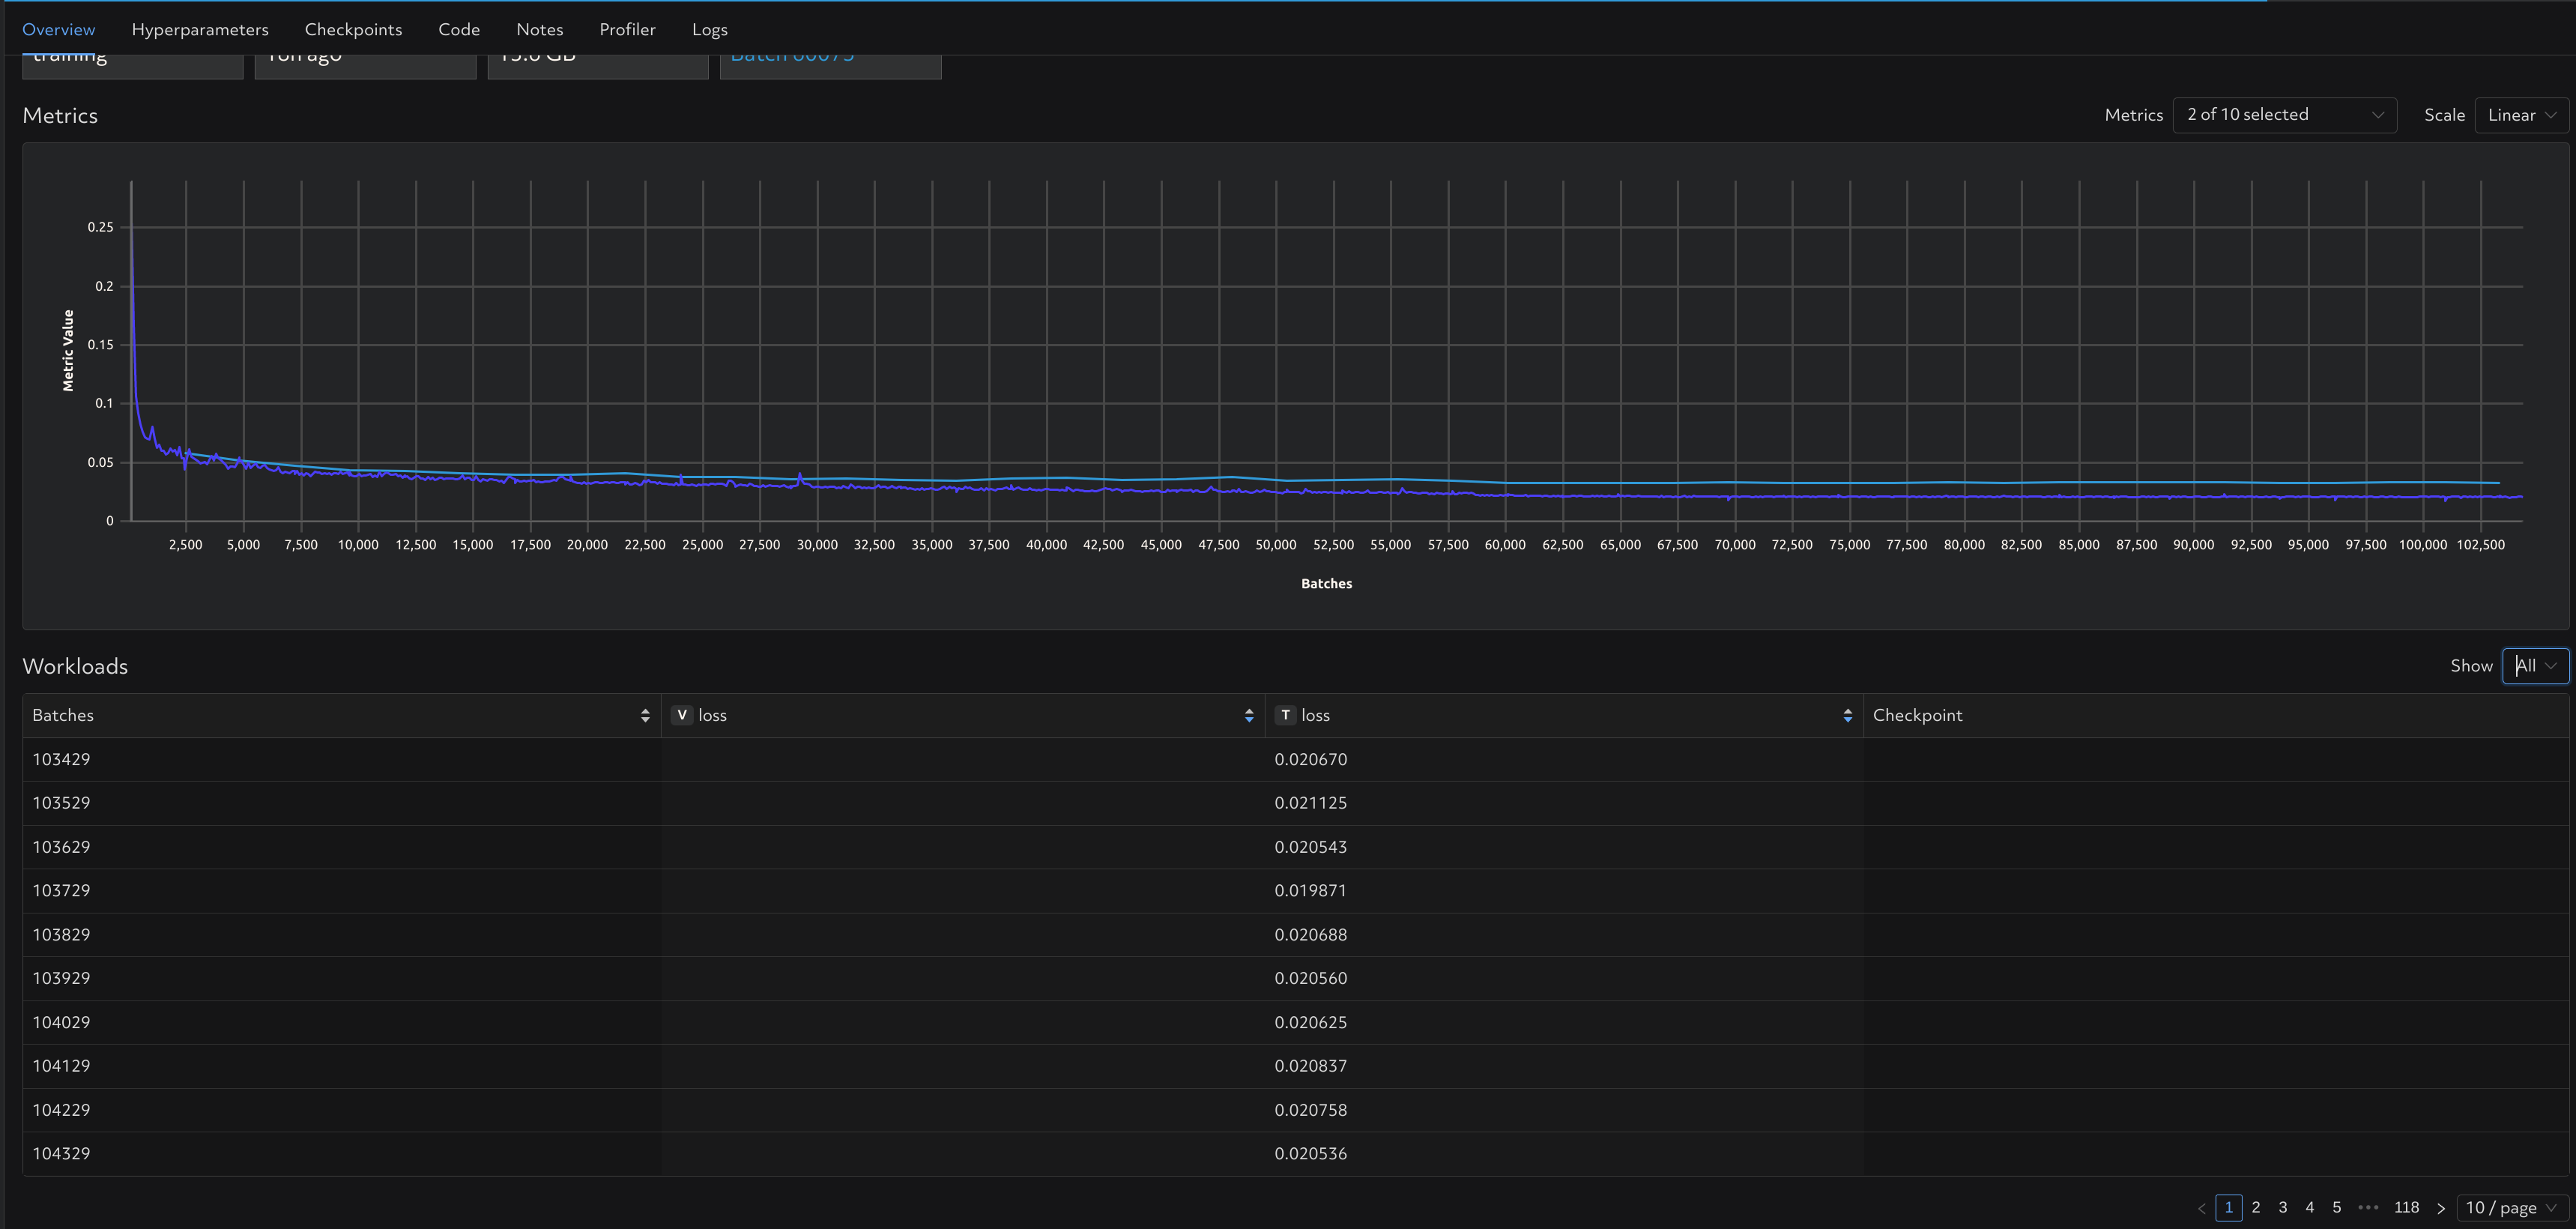
After setting to "All", it seems the number per page and the training metrics turn back to normal. So we have to use "All" mode to check the training metrics? It seems there is one issue left: even though x/page is selected, only (x/2) items are shown in the table when we select "Has Checkpoint or Validation".