Charts

Charts copied to clipboard
How i show full lines in container
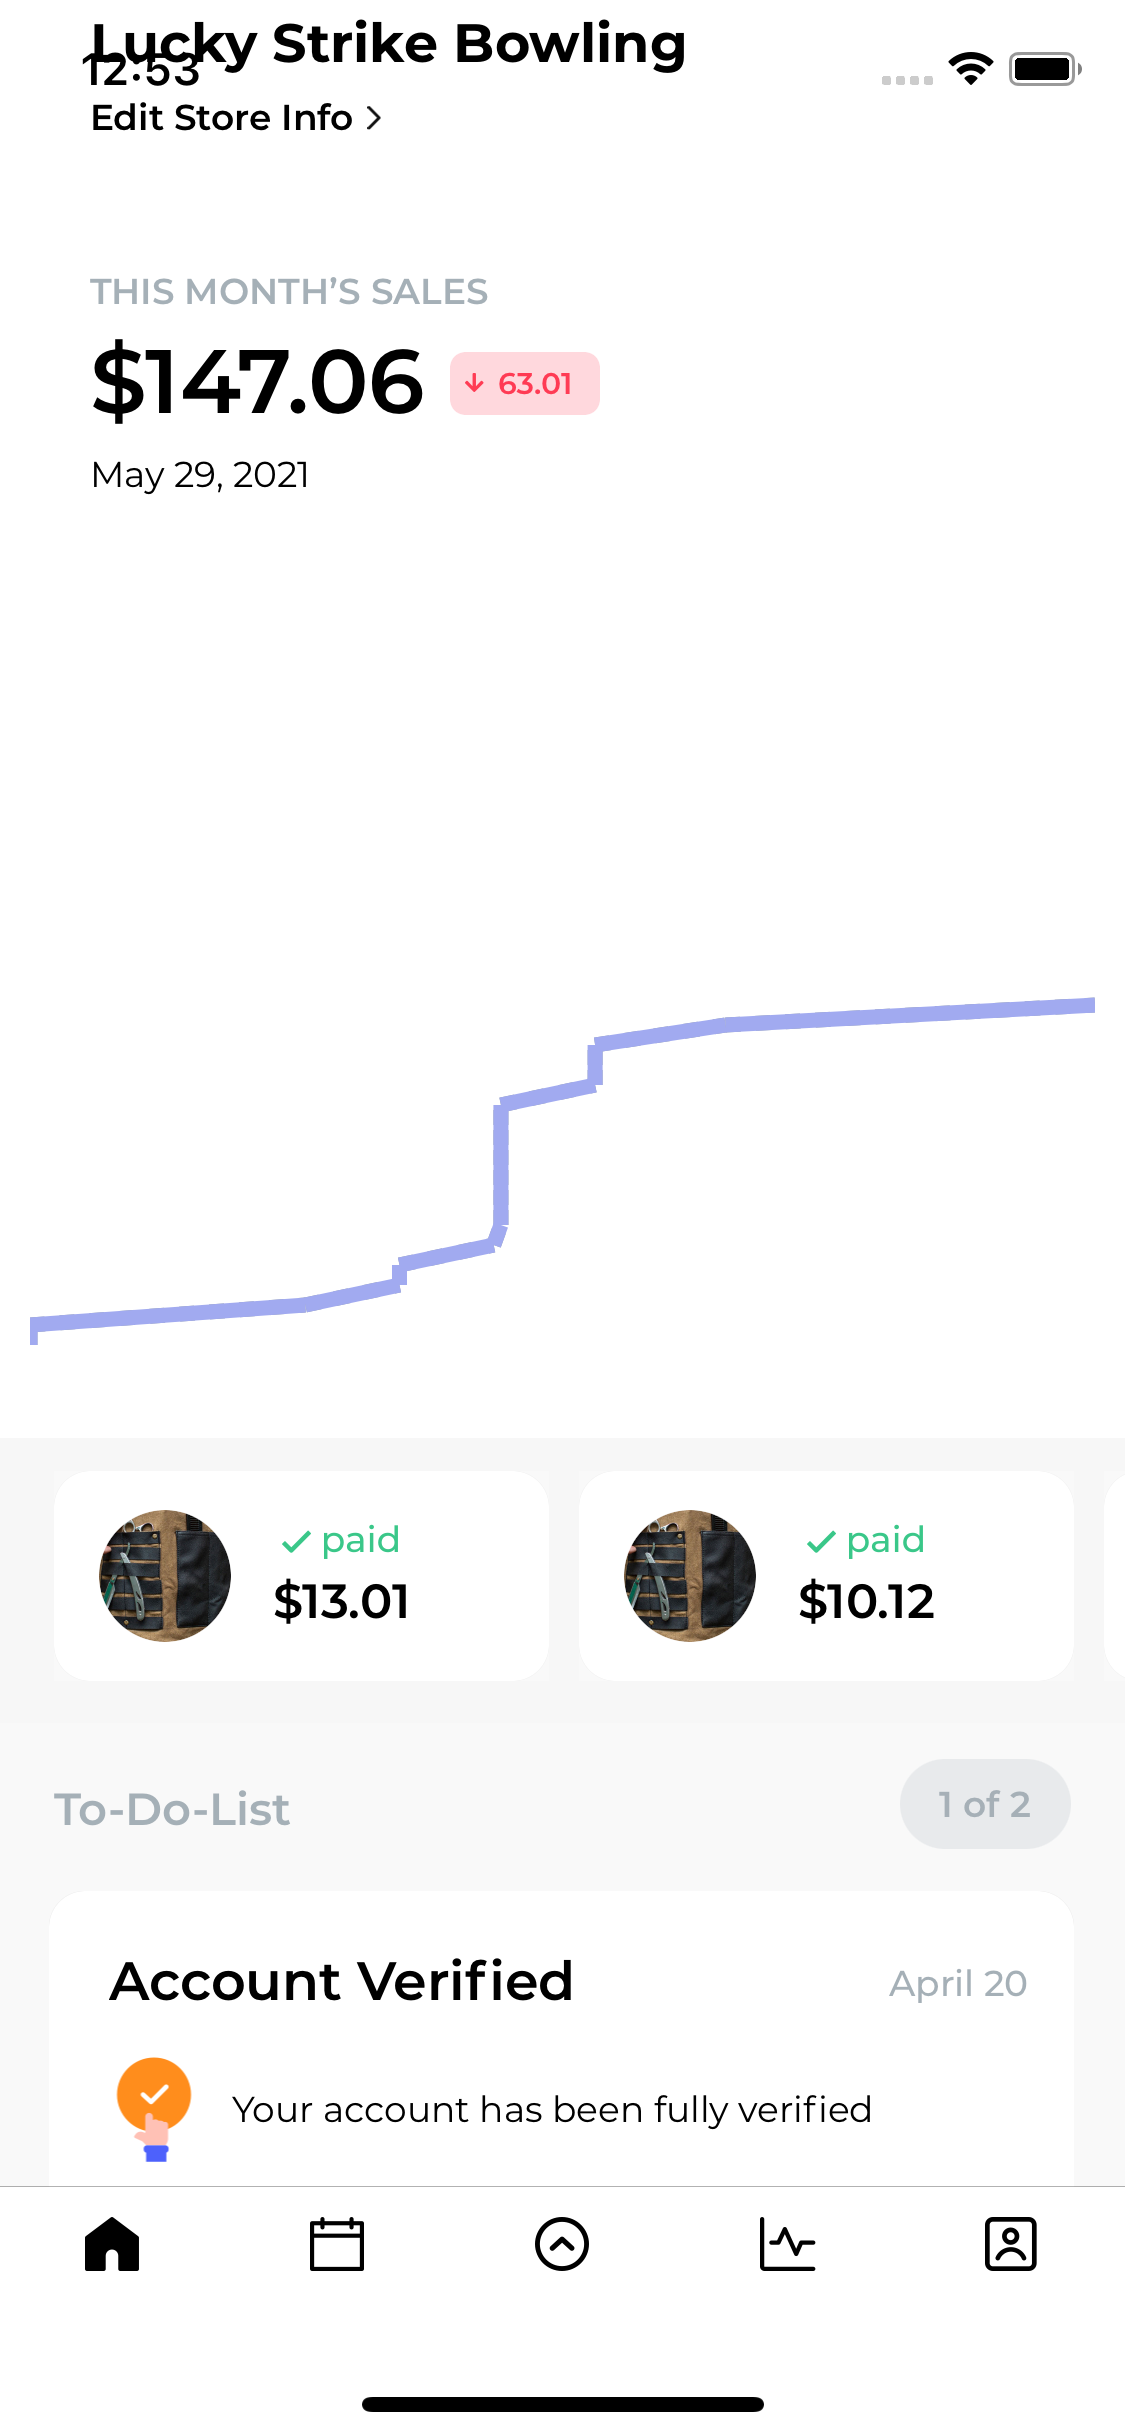
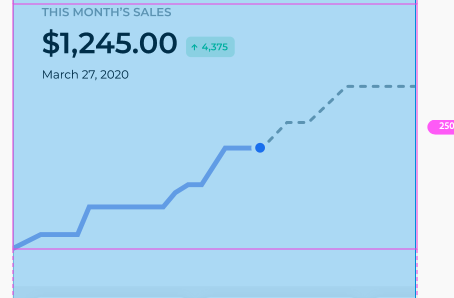
i plot 30 days data with line view but it show only some days line other lines are cutting off
i mean now i have 29 days data with solid line and the other two days with dashed line but its not showing and i dont want to scroll.
Please help me to overcome this
this is my code
func setCharts(arrChartsValue: [Int], dictNewReports: [String:AnyObject]) {
    print(arrChartsValue)

    dateFormatter.dateFormat = "dd"

    var strdate =  dateFormatter.string(from: currentDate)

    if strdate.first == "0" {

        strdate = strdate.replacingOccurrences(of: "0", with: "")
    }

    let strConvertInt = Int(strdate)!

    let firstN = arrChartsValue.prefix(strConvertInt)

    let LastN = arrChartsValue.suffix(arrChartsValue.count - strConvertInt)

    arrFirst = arrChartsValue

    arrSecond = Array(firstN)

    print(arrFirst.count)

    print(arrSecond.count)

    chartView.drawGridBackgroundEnabled = false

    chartView.drawBordersEnabled = false

    chartView.leftAxis.enabled = false

    chartView.rightAxis.drawAxisLineEnabled = false

    chartView.rightAxis.drawGridLinesEnabled = false

    chartView.xAxis.drawAxisLineEnabled = false

    chartView.xAxis.drawGridLinesEnabled = false

    chartView.xAxis.drawLabelsEnabled = false

    chartView.leftAxis.drawLabelsEnabled = false

    chartView.rightAxis.drawLabelsEnabled = false

    chartView.legend.drawInside = false

    chartView.dragEnabled = true

    chartView.setScaleEnabled(true)

    chartView.pinchZoomEnabled = false

    chartView.legend.enabled = false

    //chartView.autoScaleMinMaxEnabled = true


    chartView.notifyDataSetChanged()

    self.setChartsValue()


}


func setChartsValue() {

    var dataSets : [LineChartDataSet] = [LineChartDataSet]()

    var yVals1 : [ChartDataEntry] = [ChartDataEntry]()
    for i in 0..<arrFirst.count{
        yVals1.append(ChartDataEntry(x: Double(arrFirst[i]), y: Double(i)))
    }

    var yVals2 : [ChartDataEntry] = [ChartDataEntry]()
    for i in 0..<arrSecond.count{
        yVals2.append(ChartDataEntry(x: Double(arrSecond[i]), y: Double(i)))
    }

    yVals2[arrSecond.count - 1].icon = UIImage(named: "graph_dots")

    let firstLineDataSet: LineChartDataSet = LineChartDataSet(entries: yVals1, label: "First Set")

    firstLineDataSet.lineWidth = 5

    firstLineDataSet.drawCirclesEnabled = false

    firstLineDataSet.drawValuesEnabled = false

    firstLineDataSet.circleRadius = 0.5

    firstLineDataSet.colors = [UIColor.colorWithHexString(hexStr: "#95A0A8")]

    firstLineDataSet.setCircleColor(UIColor.colorWithHexString(hexStr: "#95A0A8"))


    let secondLineDataSet: LineChartDataSet = LineChartDataSet(entries: yVals2, label: "Second Set")

    secondLineDataSet.lineWidth = 5

    secondLineDataSet.drawCirclesEnabled = false

    secondLineDataSet.drawValuesEnabled = false

    secondLineDataSet.circleRadius = 0.5

    secondLineDataSet.colors = [UIColor.colorWithHexString(hexStr: "#A1AAF0")]

    secondLineDataSet.setCircleColor(UIColor.colorWithHexString(hexStr: "#A1AAF0"))


 //   secondLineDataSet.getEntryForIndex(secondvalues.size-1).icon = ContextCompat.getDrawable(this,R.drawable.ic_circle)

    dataSets.append(firstLineDataSet)

    dataSets.append(secondLineDataSet)

    dataSets[0].lineDashPhase = 10

    dataSets[0].lineWidth = 5

    dataSets[0].lineDashLengths = [5]

    let lineChartData = LineChartData(dataSets: [firstLineDataSet, secondLineDataSet])

    self.chartView.data = lineChartData

    chartView.setVisibleXRangeMaximum(1000);

    chartView.setVisibleYRangeMaximum(1000, axis: .left);

}