Redis logs null error
We're having issues with our redis setup, and I reached out to our cloud provider to get more info about it:
We often see this message in our logs:
2019-04-26 16:39:36 [APP/PROC/WEB/0] ERR RedisOplog - Connection to redis ended
2019-04-26 16:39:46 [APP/PROC/WEB/0] ERR RedisOplog - There was an error when re-connecting to redis {"delay":10000,"attempt":1,"error":null,"total_retry_time":0,"times_connected":12}
We only have 128 allowed concurrent connections, so I'm hoping there's only 1 connection opened per host (we have <10 hosts connected to redis in total).
The answer from their tech support is the following:
"It seems that your application ("RedisOplog") does not write out a proper error ("error":null). It would be very helpful to get the detailed error message for the error you are getting. Can you check your application if there is more information available or more information that could be printed in case of an error?"
Any idea what could be causing this? Are lots of connections being opened from the same server? What about the null error?
I get this same error from time to time. The "Connection to redis ended" then exactly ten seconds later the "There was an error when reconnecting...". It happens on all three of my Galaxy containers exactly at the same time when it happens.
For us, I see this fairly often. Maybe a few times a month. I assumed it was our Redis server on compose.io having a hiccup or something. It always seems to reconnect.
Is there a deeper issue here?
FWIW, I've been getting similar error messages, but I do have an actual error message. Still trying to track down what's causing it.
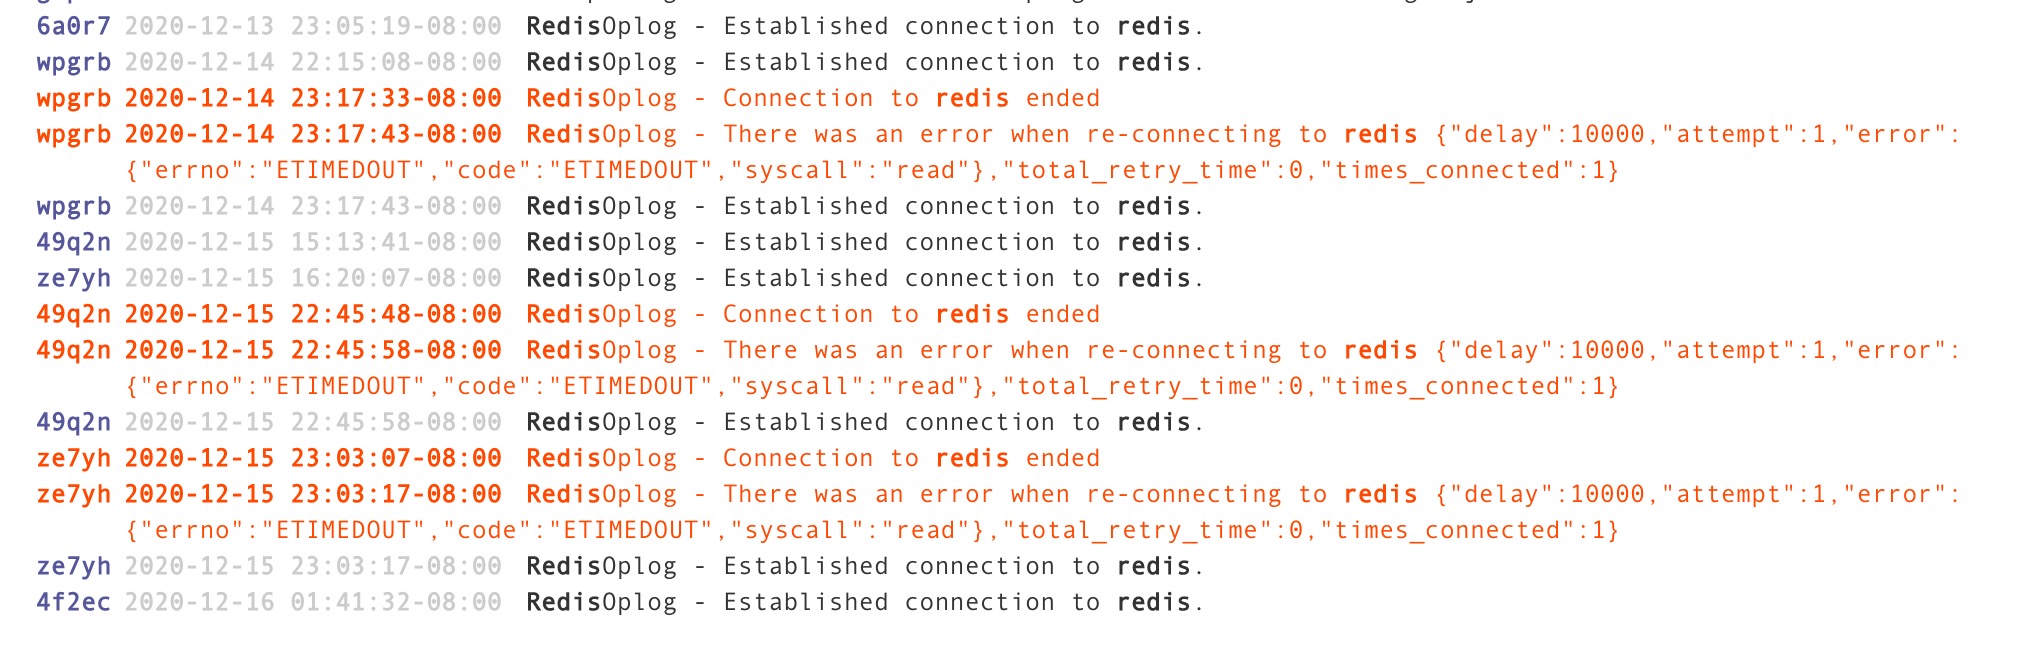
RedisOplog - Connection to redis ended
RedisOplog - There was an error when re-connecting to redis {"delay":10000,"attempt":1,"error":{"errno":"ECONNRESET","code":"ECONNRESET","syscall":"read"},"total_retry_time":0,"times_connected":1}
RedisOplog - Established connection to redis.
@edemaine We had this error all the time when we were using the original (i.e this repo). Here is what we discovered:
- The problem in our case was Meteor (actually NodeJS). It's too busy doing other things OR processing too much data from redis so the connection times out
This is a serious issue as it means you missed important messages and reactivity is broken
We solved it by:
- Reducing the number of messages (and size) that redis-oplog transmits to the bare minimum (the flag to stop protecting against race conditions makes it worse as it sends the whole doc at each update) -- this was done in our fork
- Using a stronger instance type -- on AWS we were using t3.large which is burst-based, we migrated to c5.large to get dedicated CPU
- Optimizing our app so no method / function takes too long, using
this.unblockandMeteor.defer. This is an artifact of the single-thread approach of Node. You have to return quickly from your functions to give Node the chance to read from Redis
Hope that helps
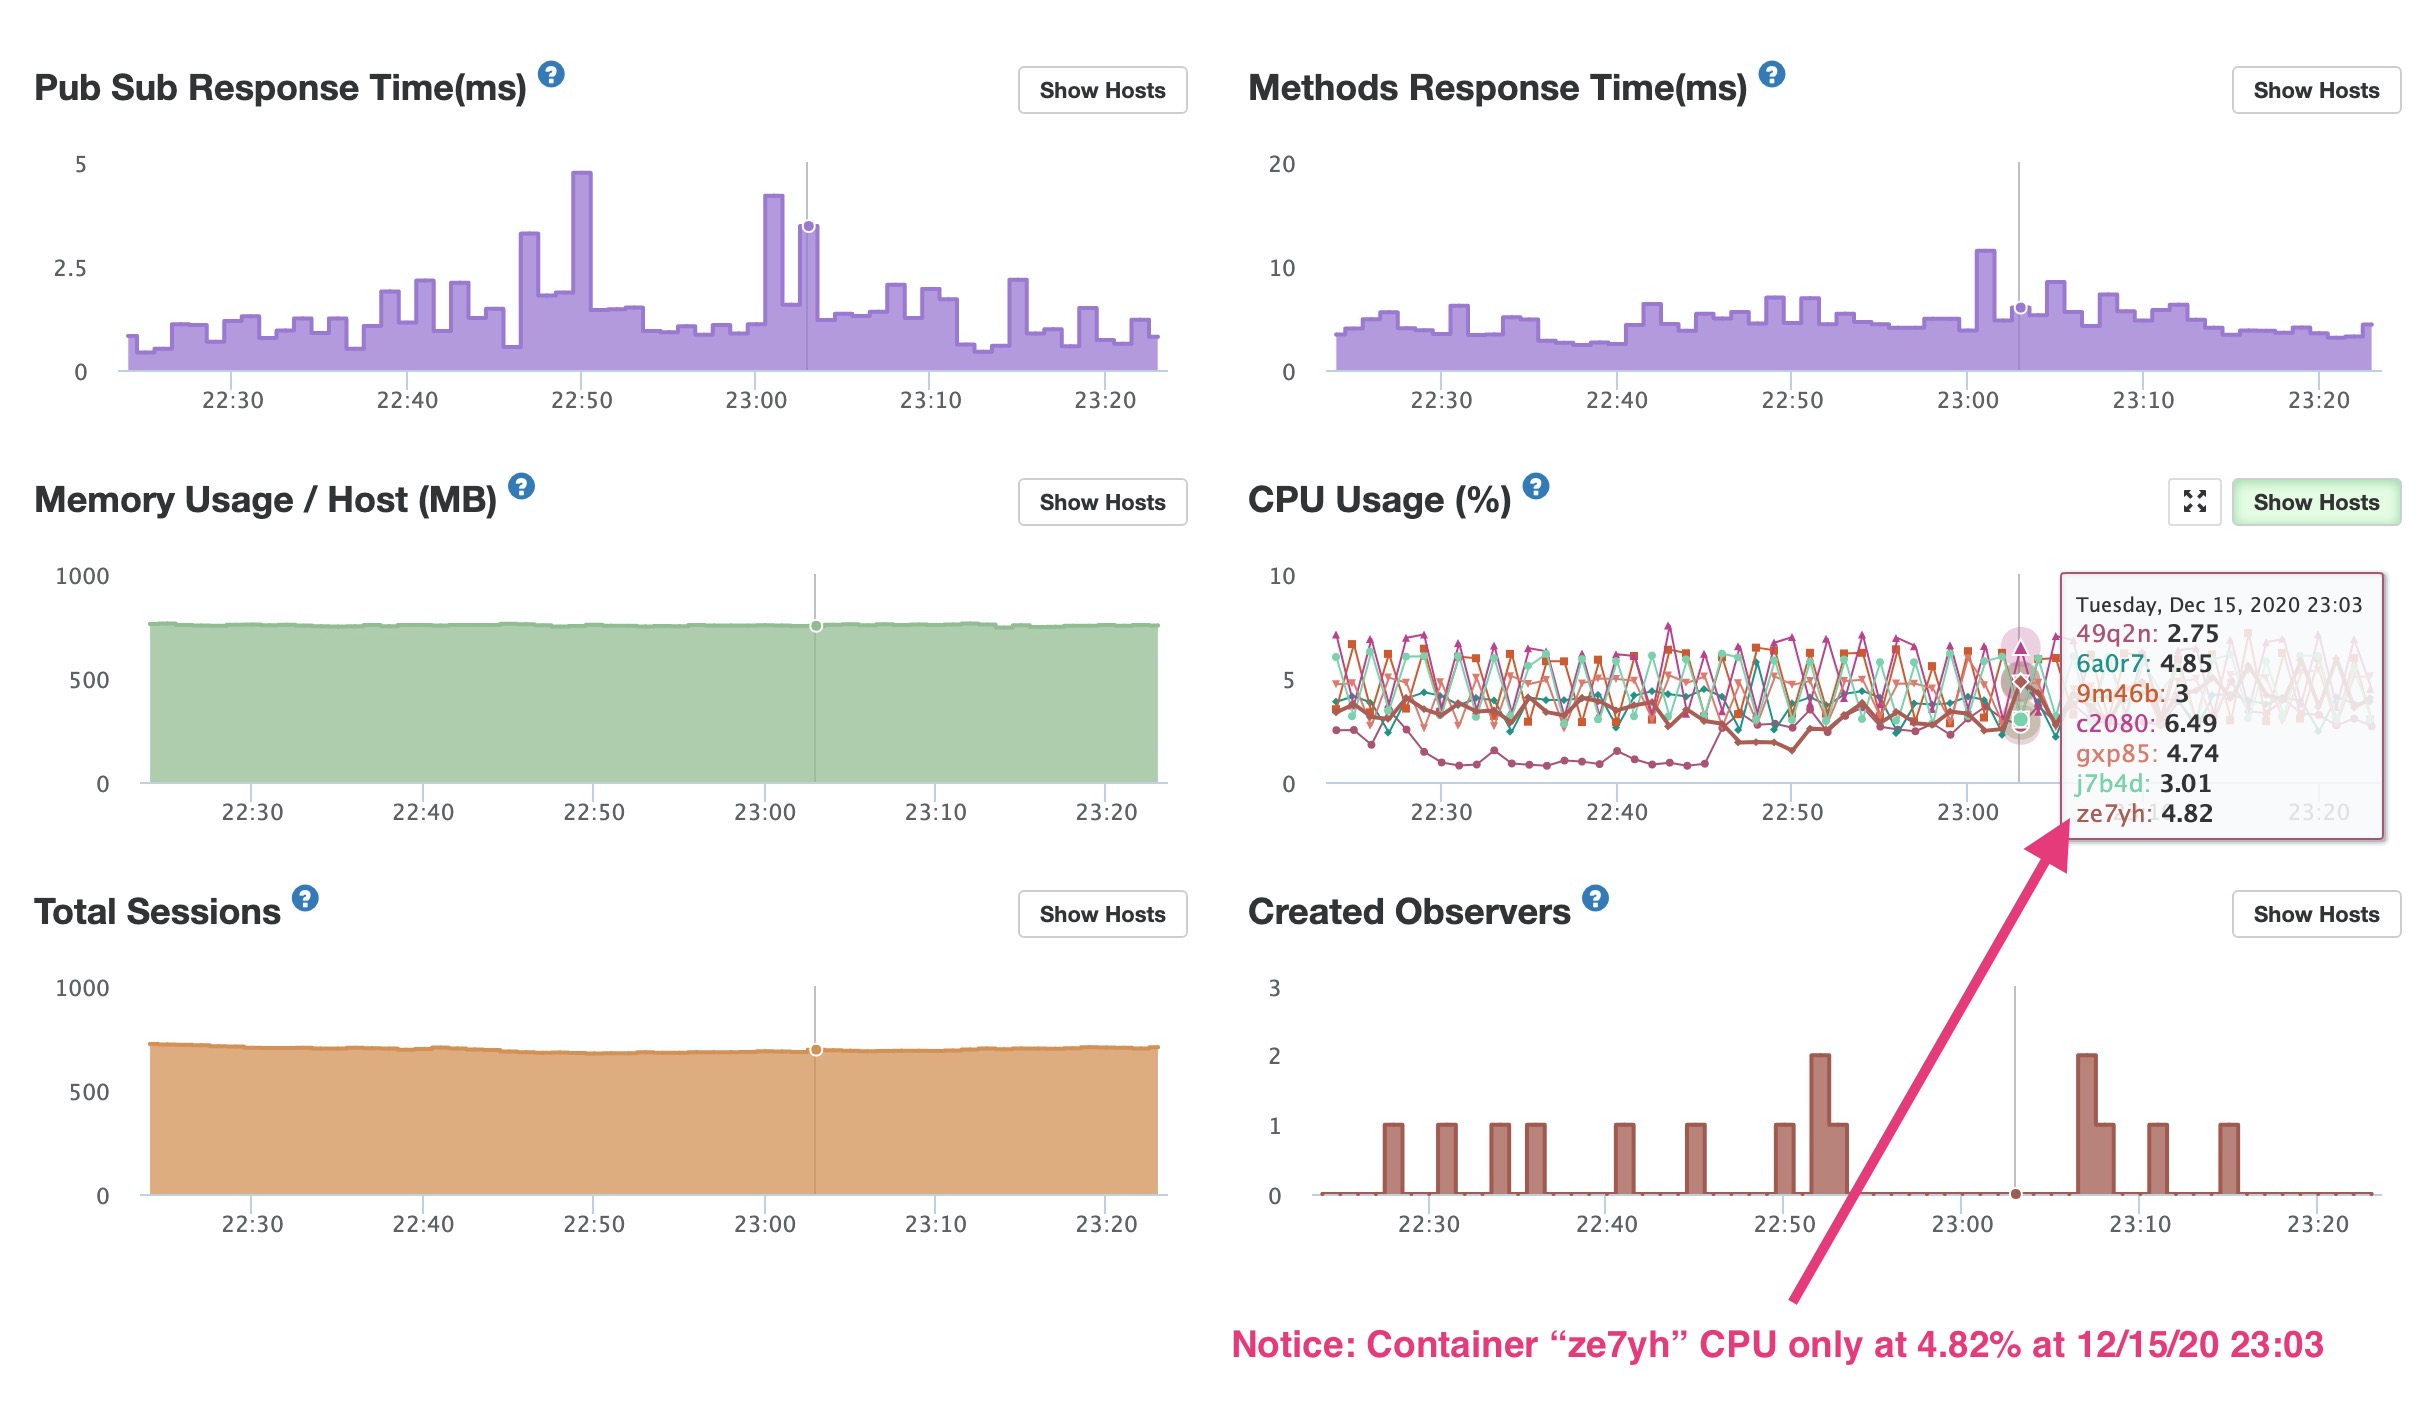
Getting this same error lately too. My containers have been really busy lately. Though, they don't seem to be maxing out to 100% CPU during these timestamps, unless Meteor APM isn't able to show a short CPU peak.
Notice that the container with the error ze7yh is at 4.82% CPU! Something must be causing this beside CPU at the time it occurs. This disconnection happened at a valley in CPU. But a few hours before it had been running at 60% - 70%.
Ouch ... if you have a timed event that causes a sudden spike APM won't show it (Meteor / NodeJS needs to send the CPU data to Kadira), however, you would see a flat (zero) line as data is missing. Something else is going on.
Are you overloading your redis instance so it disconnects? Can you check its health state?
Redis is totally fine. No blips or anything at 12/15/20 23:03. CPU is at 1%. Even at my busiest times my Redis deployment CPU never goes above 7%. Used RAM is like 160MB. No system restarts. And none of the other containers show a disconnection at that time which I think would happen if Redis overloaded.
One thing I'm curious about is a pattern I use for Meteor Methods like this:
From the client:
Meteor.call("compareParts", ..., function(...));
On the server in api/parts/server/methods.js:
import { _compareParts } from ./utils.js;

Meteor.methods({
   compareParts: function(...) {
      check(...);

      // Perform validation, return error if invalid

      //  Then call the imported "utils" function. I do this so I can reuse functions in different files
      _compareParts(...);
   }
});
On the server in api/parts/server/utils.js:
export const _compareParts = function(...) {
   //  Function code
}
Would using a pattern like this fail to show CPU usage in Meteor APM? Or perhaps cause other issues? As I use this pattern quite a bit.
There is nothing wrong in your approach, you are re-using functions
With the Kadira shots you are showing I can't pinpoint what is happening in your case. But I can tell you that we sometimes saw redis disconnects without 100% CPU's when using the cult-of-coders redis-oplog. It just made sense that we can improve things and I went with a sledge hammer and just replaced with our redis-oplog ...
BTW - are you using t instances on AWS or c ones? t are burst-based, maybe you ran out of CPU credits and it throttled?
Did anyone ever find a solution for this? I see it on many different servers in many different environments. Most of the apps are below 5% cpu and some aren't doing anything and yet the redis connection won't stay connected.
hmm, I just found this https://devcenter.heroku.com/articles/heroku-redis#timeout my DigitalOcean redis instance might have this timeout set.