sf layers aren't rendering
Layers generated from sf data objects aren't rendering - just the base map loads.
I tried the examples from here, but none of them worked.
Non sf examples are working fine.
R Version: 4.0.2 deckgl Version: 0.2.7 (CRAN) - although also tried dev version sf version: 0.9-6
@LiRogers Hi, yes you are right. I can reproduce it. It seems that jsonlite changed the way converting sf objects. It creates some kind of GeoJSON from the geometry column now. As a work around you can access the coords in this way:
library(deckgl)
library(sf)

features <- st_as_sf(bart_stations, coords = c("lng", "lat"), crs = 4326)

deckgl(zoom = 9, pitch = 35) %>%
  add_column_layer(
    data = features,
    getPosition = JS("d => d.geometry.coordinates"),
    getElevation = ~exits,
    getFillColor = JS("d => [48, 128, Math.sqrt(d.exits)]"),
    getTooltip = ~name
  )
Just replace ~geometry with JS("d => d.geometry.coordinates") in the sf examples.
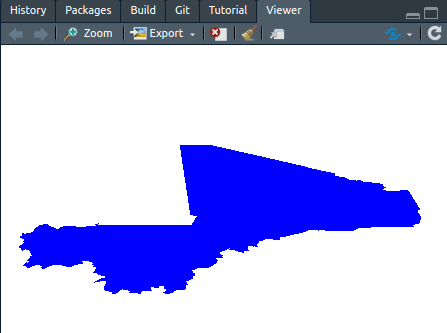
@crazycapivara somehow JS("d => d.geometry.coordinates") fails to render polygon lines, or maybe I'm not declaring getLineWidth properly?
library(raster)
mli <- getData("GADM", country="MLI", level=2)
mli <- st_as_sf(mli)

props = list(
  getPolygon = JS("d => d.geometry.coordinates"),
  pickable = TRUE,
  stroked = TRUE,
  filled = TRUE,
  wireframe = TRUE,
  getLineWidth = 2,
  getLineColor = "black",
  getFillColor = "blue"
)

deckgl(
  element_id = "mapgl",
  longitude = -8,
  latitude = 11,
  zoom = 6,
  bearing = 0,
  pitch = 60,
  maxPitch = 89,
) %>%
  add_polygon_layer(data=mli, properties=props)
plot(mli[1])
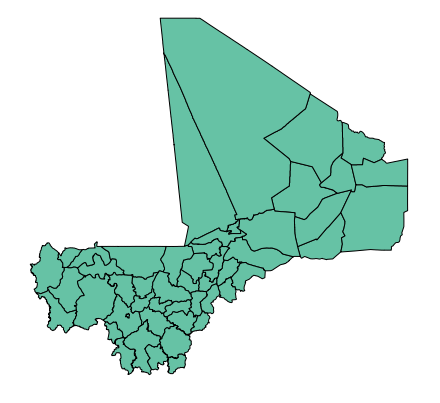
Ignore, figured it needs:
props = list(
  getPolygon = JS("d => d.geometry.coordinates"),
  pickable = TRUE,
  stroked = TRUE,
  filled = TRUE,
  wireframe = TRUE,
  getLineWidth = 2,
  getLineColor = "black",
  getFillColor = "blue",
  lineWidthMinPixels = 1 # !!!
)