mir_eval
 mir_eval copied to clipboard
[CR] matplotlib modernization
This PR will fix #364
This is still in-progress, but the basic idea is to use temporary artists to probe the axes style cycler indirectly, rather than accessing private / undocumented axes attributes.
So far, all the patch-based artists (segments etc) and spectrogram displays seem to work on my local environment, as well as events. I haven't started on pitch yet, as these need a rewrite IMO.
A couple of things to think about:
- There isn't a clean way in matplotlib to probe the "style" attributes of an artist, as distinct from all attributes. We might just need to be explicit about what properties we're willing to inherit from the cycler and which ones we aren't.
- Labeled interval display needs a rewrite due to the deprecation of
BrokenBarHCollection. We could rewrite this asPolyCollection, but will need to explicitly construct our own polies. - It will probably make sense to extend the functionality of
freq_to_voicingto handle nans, as was done in #379. To prevent some unintended consequences, this behavior might need to be disabled by default.
Status update on this PR (still working at it when I can):
- It's likely to be a near total rewrite of the display module. I did very many bad things in #28 and we're paying for it now :sweat_smile:
- I'm going to try to keep things as API-compatible as possible, and put in deprecations as needed.
- Some of the styling and default look is likely to change, and we'll need to regenerate the test fixtures accordingly. TLDR: we were doing some things with, eg, axis margins that really should be out of scope for a matplotlib artist generator (and better handled through rcparams on the user end), and now's the best time to streamline.
- The following functions are now, more or less, up to date and working (but could use some polish):
- segment
- separation
- events
- Pitch and multipitch will be more or less easy to update, I just haven't gotten to it yet.
- labeled intervals (and related methods, piano roll, hierarchy) is a real headache due to changes in mpl default axes construction. I'm still getting my head around how this should work now.
This comment summarizes some thoughts on the display module design after I sank way more time and thought into it yesterday than I really should have.
TLDR: I'm becoming convinced that we need to maintain our own independent state objects for managing multiple calls to display on the same axes object. I also think I have a viable way to do this, and it's only a little ugly.
Problem 1: managing styles and cycles
Matplotlib axes are stateful in how they allocate styling for (some) artists. Calling ax.plot multiple times will iterate through the cycler object automatically, ditto for patchy artists like ax.bar. (Not so much for primitives like axvspan, so coverage is not exactly uniform here.) Under the hood, this is implemented by a couple of cycler objects that are stored within the axes object, and accessed / incremented whenever a new artist of the appropriate type is created.
This is behavior that I believe we should retain for most annotation displays, with the exception of segment (which iterates through multiple colors already). Unfortunately, we can't rely on the built-in matplotlib functionality to do this for us because we often need to use primitive artists (Rectangle, axvspan, etc) rather than the more high-level artists (plot, bar).
Originally, I'd coded our display module to hijack the appropriate cyclers from the axes object, but this no longer works due to internal changes in the axes structure. We really should never have been stealing these cyclers in the first place, alas.
Presently, this PR replaces hijacking by pickpocketing: instead of accessing the cyclers directly, it creates temporary artists of an appropriate type, borrows their styling parameters, and then removes them from the axes afterward. This is dirty, but it works, and technically it plays by the rules of the API so it's unlikely to break. Still, I think we might want to replace it by our own state management due to problem 2...
Problem 2: managing tick positions and labels
Labeled interval plots map the label set onto the vertical axis, with tick locations and labels set up accordingly on ax.yaxis. Subsequent calls a labeled interval plot may expand the existing axis so that additional labels can be included.
For example, 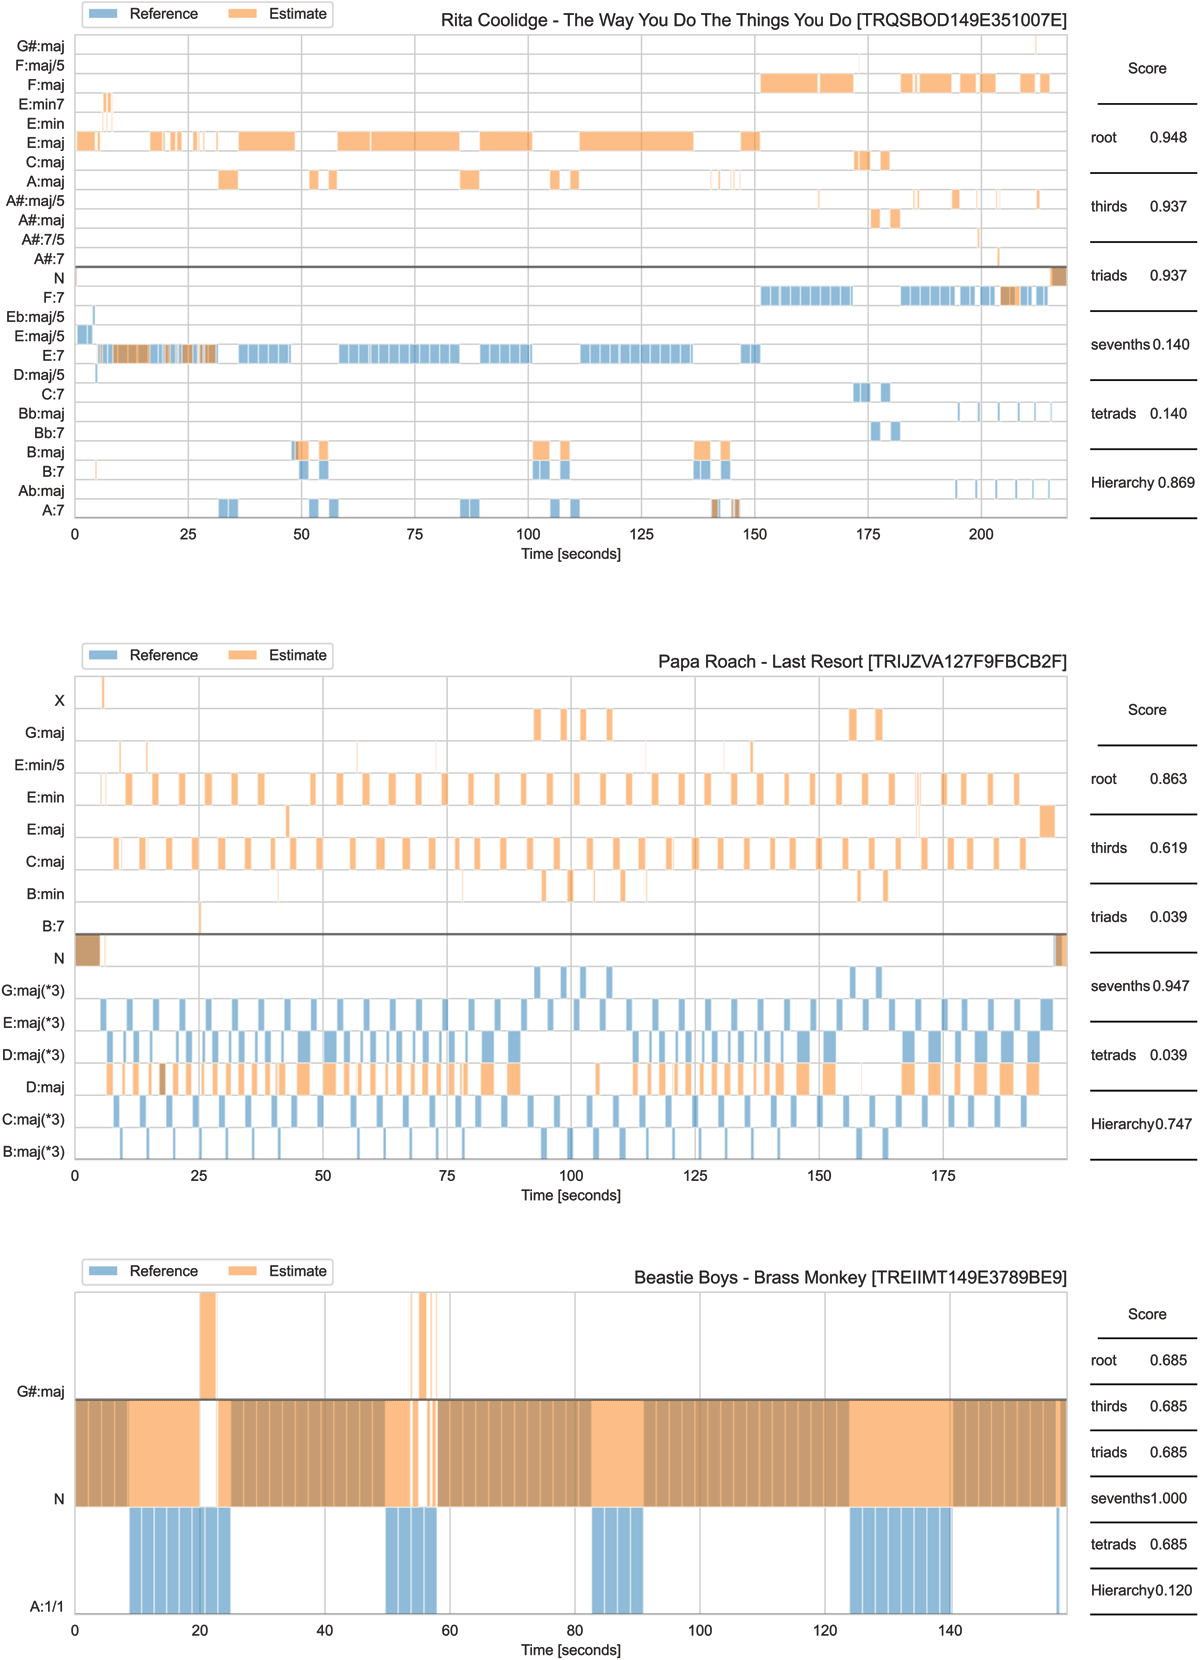 uses this subsequent plot idea to show where two annotations agree or disagree (three subplots for three different tracks).
Of course, this relies on detecting whether labeled interval plots have already been drawn on the axes object, gathering the existing label set, etc. As originally implemented, this was done by probing ax.yaxis.get_ticklabels(), which would be empty on a fresh axes object, and otherwise we assume that it's been populated by a prior labeled interval plot and treat the ticklabel collection as an existing vocabulary. Unfortunately, this no longer works, as newly created axes now come with default tick positions and labels.
Now, in principle, this is exactly what matplotlib categorical axes are supposed to do for us. However, the API for that is a bit underpowered for how we would need to use it (eg expanding an existing vocabulary set, doing math on positioning information, etc...). As a result, I think we need a more explicit state management scheme.
Potential solutions
There are two ways I could imagine going about managing state: burying it in the axes object, or maintaining our own object. In either case, this state object would be used to maintain a sandbox of stuff we need for managing plots, such as cyclers, label sets, label→coordinate maps, and so on.
Option 1: axes._mir_eval
This is in some ways the simplest thing to do: stuff whatever information we need inside a container of some kind (dict?) and add it as an attribute to the axes object. I expect this would work, but it's phenomenally bad style, and may cause headaches down the road e.g. if axes objects are serialized and deserialized, having to go through a marshall that rejects unknown attributes. (It could happen..)
I don't think we're likely to bump into namespace conflicts with this.
Anyway, I asked about this idea on the matplotlib discourse, and so far it's :cricket:...
Option 2: mir_eval.display.axes_state
Instead of stuffing our state dict into the axes object, we can maintain our own module-level mapping of ax → state.
This preserves cleanliness of the axes object, so there's no question of us playing by the API rules. It's extremely unlikely to break on us down the road, unless axes objects become unhashable.
I see two downsides here:
- All state is confined to the runtime, so we wouldn't be able to, say, save a figure, load it up later, and continue working on it. I don't think this use-case is very common, but I could imagine it happening.
- We now have an extra handle on each
axesobject that passes through mir_eval (through dict.keys). For long-running sessions with lots of interactively generated plots, this could really chew up memory even if figures are closed.
(2) I think can be mitigated by using a weakref.WeakKeyDictionary instead of a vanilla dict. This way our state mapping doesn't count toward the axes object's references, so we shouldn't balloon out of memory in long-running sessions.
(1) is trickier, and subject to the same problems as option 1 re: serialization. For the record, I'm okay with saying that cross-session support is out of scope (it feels very unmatplotlibish anyway).
Thanks for this wildly in-depth sleuthing. How bad will the memory issues get, really? My guess is that it would only affect a very small percentage of uses, and probably if it did cause an issue, the user should just implement things differently/start a new session... but maybe that's wrong. Could we do something where whenever the mapping is accessed, we do a quick loop through the existing handles to check for and remove references to closed figures, or something? This would result in a small amount of computational overhead, I think, but I would guess it was quite small...
Thanks for this wildly in-depth sleuthing. How bad will the memory issues get, really?
Ehhh, most of the time it would be fine, but in some cases it could be quite bad. For example, I sometimes find myself in a long-running jupyter session, doing tons of interactive plots (paging through model outputs, etc). Without a proper handle on garbage collection, this could get quite bad, especially for the more intensive viz like multipitch. Starting a new session isn't a great option there, IMO, because these things sneak up silently in the background.
Could we do something where whenever the mapping is accessed, we do a quick loop through the existing handles to check for and remove references to closed figures, or something?
It's tricky because we'd need to access matplotlib global state to find all open handles, and I don't think that's very well supported. Additionally, since axes handles are not hashable, we'd have to go through some kind of proxy indexer anyway, and that has a host of annoying problems as well.
TLDR: I don't think there's any kind of elegant solution right now. Sandboxing our own data in the axes object might be short-term viable, but I'd like to get some input from a matplotlib export (dev?) on how bad this could go before i start thinking about it in depth.
Back on this for a bit today, came across this issue, which if resolved, would almost cover half of what we need here: https://github.com/matplotlib/matplotlib/issues/19479 (making cycler's accessible / sharable across axes)
It wouldn't help with the categorical axis tracking problem though.
Either way, it doesn't seem likely to be resolved soon, so I don't think we can wait for it to get this PR unstuck and 0.8 out the door.
OOOoookay, I think I have a clumsy prototype with weakkeydict that actually works.
It turns out that it does actually work fine with axes objects directly, but the problem is that triggering a purge requires us to locate (and remove) all existing handles to an axes object. This is exactly as it should be, and the only challenge is actually identifying the refs.
Here's what works:
import matplotlib.pyplot as plt
import weakref
import gc

D = weakref.WeakKeyDict()
fig, ax = plt.subplots()

D[ax] = "some stuff"
print("Before deletion: ", dict(D))
... # do stuff

# Trigger a cleanup
fig.clear()
del ax
gc.collect()
print("After deletion: ", dict(D))
The result is now as we should hope:
Before deletion:
{<Axes: >: ‘foo’}
After deletion:
{}
It turns out that both steps are necessary. (GC collection is necessary only insofar as we shouldn't expect cleanup to be immediate, and this forces things to update.)
The mistake I made previously was using del fig instead of fig.clear(). I'm trying to get some clarification on why this distinction matters—I would expect fig.del to invoke a clear as part of its teardown, but I may be missing something.
It's a bit cumbersome to expect users to explicitly clear figures, but this at least verifies that the approach I have in mind is possible. We might be able to use weakref's finalize functionality to automate this clear when ax.figure gets deleted, but it'll take a bit of experimentation to see if this works.
This modernization PR is getting unstuck now. I'm doing a bit of cleanup along the way and regenerating regression test targets where needed (eg because font rendering changed slightly).
I haven't yet started on cycler management, but that should be relatively easy compared to the tick management stuff.
Most things are basically working now, though I did hit a snag on piano roll viz on which I could use a second opinion.
The old version, using midi ticks, made plots like this by calling out to the labeled_intervals function:
In the revised implementation, it now looks like this:
Basically everything is the same here, except the display range limiting behavior is a little different. I have a slight aesthetic preference for the old version (barring the missing 0 time tick, which is now fixed). The revised implementation does have some benefits though, in that the vertical extent is always the MIDI range.
I thought about hacking it to only use the note range encoded in the data (instead of the full 0-128), but this would actually break things when it comes to label set extensions across multiple calls on the same axes.
What do folks think? I'm inclined to declare new behavior here, and folks can always zoom in later if needed, but as I said above, second opinions are welcome.
Thanks for your work on this. The new version seems reasonable, but I do prefer the truncated y range - the new version isn't actually covering the full y range, is it? MIDI would be 0->127, unless I'm misunderstanding.
the new version isn't actually covering the full y range, is it? MIDI would be 0->127, unless I'm misunderstanding.
Yeah, good catch. This is from https://github.com/craffel/mir_eval/blob/6b82ddef3675ba7613aa454f74bc182ee3ade4a3/mir_eval/display.py#L713
Removing that line keeps the plot on the full midi range. I think the reason it's now stretching down to the bottom is from the phantom bar plot that I'm currently using to hijack the styling - there doesn't seem to be a clean way to keep it out of the auto limit calculation. (The phantom bar plot lives at (0.5, 0.5), so auto-limit needs to cover that range.)
Let's revisit this after I rewrite the styling code to use fresh cyclers and we can remove the hijacking kludge.
Codecov Report
Attention: Patch coverage is 65.21739% with 48 lines in your changes are missing coverage. Please review.
Project coverage is 95.67%. Comparing base (
ca6d7b2) to head (414bddf). Report is 1 commits behind head on main.
| Files | Patch % | Lines |
|---|---|---|
| mir_eval/display.py | 64.96% | 48 Missing :warning: |
:exclamation: Your organization needs to install the Codecov GitHub app to enable full functionality.
Additional details and impacted files
@@            Coverage Diff             @@
##             main     #380      +/-   ##
==========================================
+ Coverage   88.32%   95.67%   +7.34%
==========================================
  Files          19       19
  Lines        2878     2936      +58
==========================================
+ Hits         2542     2809     +267
+ Misses        336      127     -209
| Flag | Coverage Δ | |
|---|---|---|
| unittests | 95.67% <65.21%> (+7.34%) |
:arrow_up: |
Flags with carried forward coverage won't be shown. Click here to find out more.
:umbrella: View full report in Codecov by Sentry.
:loudspeaker: Have feedback on the report? Share it here.
Let's revisit this after I rewrite the styling code to use fresh cyclers and we can remove the hijacking kludge.
Got this part done, and it's definitely much cleaner: no more temp artists, and we replicate the kind of logic that matplotlib uses under the hood for managing property cyclers. Users can also specify a custom cycler, eg:
import cycler

prop_cycler = cycler.cycler(color=["#ff00ff", "#ffff00", "#00ffff"])

mir_eval.display.separation([x0, x1, x2], fs=fs, prop_cycle=prop_cycler)
plt.legend()
renders the following:
The default behavior respects whatever your matplotlib theme is, so you can also do:
with mpl.style.context('ggplot'):
    mir_eval.display.separation([x0, x1, x2], fs=fs)
    plt.legend()
to get
I was able to remove almost all code that relates to fudging axes margins around our artists, which really should not be our business anyway. This will break backward compatibility, but I'm fine with it.
The lingering exception here is segments plots, which I'll try to clean up before signing off on this. The issue is that generating Rectangle patches manually does not automatically factor into data limit calculations, and we should instead replace them with vspans. However, doing so creates a challenge for the interpretation of the base and height parameters, which were previously in data coordinates and would have to change to axis units. I think this is basically fine, but it does create a bit of mismatch between segments and labeled_intervals where the base and height parameters need to be in data space. Not sure I have any brilliant ideas on this, but it's worth noting.
Alright, I'm sticking a fork in this. :sweat_smile:
All deprecated functionality is purged. Property cyclers are used everywhere, limiting and scaling behaviors are all compliant with matplotlib idioms. Generated figures should, I believe, be as "unscented" as possible now, at the cost of a bit of backward compatibility.
There are probably some untested code paths here, but I'll wait til the dust settles to start digging into that. At this point, it'd be worth looking through the replacement images in the PR to see how things look by default now.
Thanks for this epic effort. I wonder how many people are aware of this incredible micro-library.
I left some comments re: axis scaling - it leaves some funny whitespace only on the top in some cases, and I think it also revealed something that is not a bug but was just invisible before. I'm ok to ignore these if you're tired of chasing demons.
it leaves some funny whitespace only on the top in some cases
Heh. The "some cases" here is doing a lot of work :grin: What's actually happening is that margins are added for any artists that live entirely in data space - this is a matplotlib thing. For some artists, eg events or segments, they actually live in a blended coordinate space where the horizontal extent is data and the vertical is axis; think "axvspan" or "axvline" and you've got the idea.
It does make for a somewhat incongruous set of figures, but I think the behavior here is correct. It makes it possible, for example, to easily overlap events or segment plots on another plot where the vertical extent has some other meaning (eg a spectrogram). This kind of use case doesn't make sense for labeled intervals, or if it does, it should be using twinned axes because we need the vertical dimension for label data.
I wonder how many people are aware of this incredible micro-library.
At least 2? :shrug:
It now appears that CI is going to be a real pain. From a quick glance of the logs, here's what I'm seeing:
- minimal env (py3.7, mpl 3.3):
__________________________ test_display_segment_text ___________________________
Error: Image files did not match.
  RMS Value: 8.579364221863347
This is the only failure, and I suspect it might have something to do with how clipping paths work in annotation objects with transformed bboxes. May need to boost the minimal mpl to get this working, but I'll dive through the changelogs to figure that out.
- ubuntu, py3.8, mpl 3.7: same issue as above.
- ubuntu, py3.10, mpl 3.8: passes
- ubuntu, py3.11, mpl 3.8: passes
- all platforms, py3.12 (latest): fails ever-so-slightly:
____________________________ test_display_pitch_hz _____________________________
Error: Image files did not match.
  RMS Value: 6.050615498994022
  Expected:
    /tmp/tmply_h95uv/test_display.test_display_pitch_hz/baseline.png
  Actual:
    /tmp/tmply_h95uv/test_display.test_display_pitch_hz/result.png
  Difference:
    /tmp/tmply_h95uv/test_display.test_display_pitch_hz/result-failed-diff.png
  Tolerance:
    6
___________________________ test_display_separation ____________________________
Error: Image files did not match.
  RMS Value: 6.487096065620065
  Expected:
    /tmp/tmply_h95uv/test_display.test_display_separation/baseline.png
  Actual:
    /tmp/tmply_h95uv/test_display.test_display_separation/result.png
  Difference:
    /tmp/tmply_h95uv/test_display.test_display_separation/result-failed-diff.png
  Tolerance:
    6
________________________ test_display_separation_label _________________________
Error: Image files did not match.
  RMS Value: 6.487213485163204
  Expected:
    /tmp/tmply_h95uv/test_display.test_display_separation_label/baseline.png
  Actual:
    /tmp/tmply_h95uv/test_display.test_display_separation_label/result.png
  Difference:
    /tmp/tmply_h95uv/test_display.test_display_separation_label/result-failed-diff.png
  Tolerance:
    6
These might just be down to font rendering deviations or differences in margin. I'll replicate the environment locally if I can to see what's up.
OSX is also giving separation heisenbugs again :facepalm: ...
I suspect it might have something to do with how clipping paths work in annotation objects with transformed bboxes.
Confirmed locally: mpl 3.3 does not clip annotations properly with tranformed bboxes. I can live with this, but bumping to a more recent matplotlib would mean dropping python 3.7 support.
Bisecting out a minimal mpl version that replicates current behavior is proving to be challening... the figure as generated on mpl 3.3 looks "okay" though, so I think the failure here is not a deal breaker. Perhaps we just allow this test to fail on the minimal environment with an xfail marker.
It looks like the failing python 3.12 builds are likely due to an old version of freetype (2.6.1) ; the older python versions (3.11, 10) have the more recent freetype 2.12.1.
This kind of thing has caused headaches over in librosa land in the past, where we hacked around it as follows: https://github.com/librosa/librosa/blob/5022290888d7c8f7f802d73805b2fd4873ca04c6/tests/test_display.py#L30-L32 ... https://github.com/librosa/librosa/blob/5022290888d7c8f7f802d73805b2fd4873ca04c6/tests/test_display.py#L115-L123 ie skipping tests that were known to cause problems on old freetype versions.
@craffel if you're cool with this, I can hack it in here and we can get this show on the road.
Implemented the freetype workaround and the only remaining failure here is in source separation (osx) and is unrelated.