cpu-time: investigate (*iavl.Node).get CPU consumption which shows up in profiles
Summary of Bug
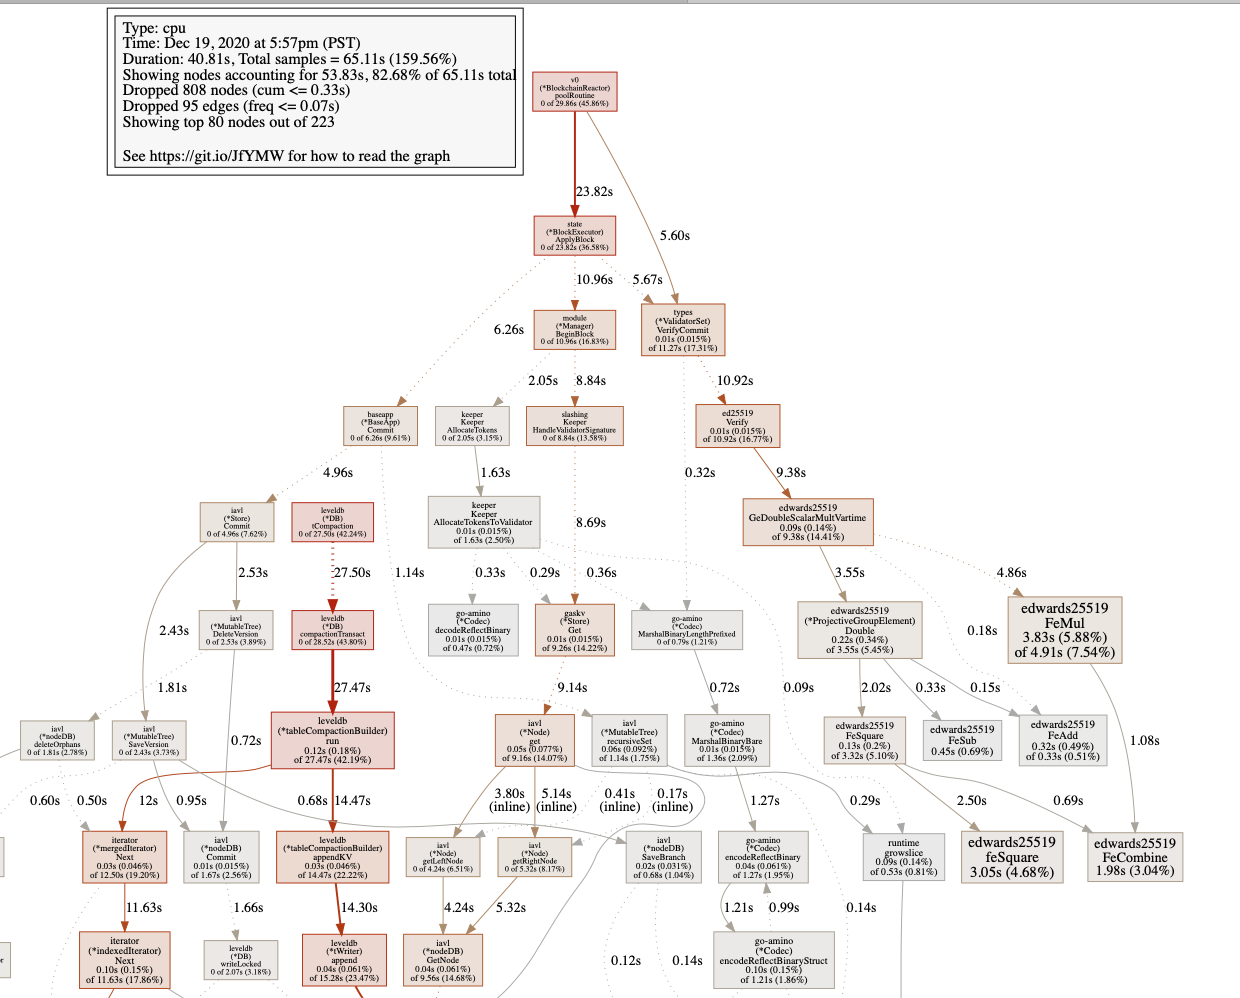
I attached some proprietary continuous profiling code to gaiad and started it, and it is running, from which I collect continuous profiles. The results of the consumption from iavl.Node show lots of time from iavl.Node operations consistently being consumed, across multiple profiles consistently.
Performance issues are (potential) security issues, and solving them always wins for everyone.
Profile
Version
At tip 25bb17d
For Admin Use
- [x] Not duplicate issue
- [x] Appropriate labels applied
- [x] Appropriate contributors tagged
- [x] Contributor assigned/self-assigned
Yes, still on my TODO list that I’ll tackle this quarter. Thanks for the ping.
On Mon, Apr 12, 2021 at 2:09 AM Marko @.***> wrote:
Is there an actionable here?
— You are receiving this because you were assigned. Reply to this email directly, view it on GitHub https://github.com/cosmos/cosmos-sdk/issues/8204#issuecomment-817634273, or unsubscribe https://github.com/notifications/unsubscribe-auth/ABFL3V3RVHUPEXGAYCUXJ23TIK2GHANCNFSM4VCXIOUQ .
I'm not sure if its worth spending too much time within IAVL as we plan to migrate away from it
Yeah, my understanding is this is showing the time spent in a seek, of crawling the tree and at each layer doing a file open.
closing this as we are working on data locality and general clean up of this repo