rioxarray
 rioxarray copied to clipboard
Clipping problem at poles
Code Sample
Example 1:
import numpy
import xarray
import rioxarray

numpy.random.seed(0)
temperature = 15 + 8 * numpy.random.randn(20,20)
lon = numpy.linspace(0,359.9,20)
lat = numpy.linspace(-88,-50,20)
xda = xarray.DataArray(data=temperature,
                       dims=["x", "y"],
                       coords=dict(x=(["x"], lon),
                                   y=(["y"], lat)))
xda.rio.set_crs("EPSG:4326")

geometries = [{'type': 'Polygon',
               'coordinates': [[[0,-70],[90,-80],[180,-70],[270,-70],[0,-70]]]}]
clipped = xda.rio.clip(geometries, crs='EPSG:4326')
print(clipped)

<xarray.DataArray (x: 13, y: 5)>
array([[      nan,       nan,       nan, 27.262234,       nan],
       [      nan,       nan, 21.219923,  2.088817,       nan],
       [      nan,  1.958413, 18.702258,  7.741613,       nan],
       [30.167113, 24.430237, 13.560601,  6.433979,       nan],
       [30.548969, 11.691048,  9.020362, 30.383536,       nan],
       [      nan, 11.518772, 29.79411 , 20.378358,       nan],
       [      nan,       nan, 23.93613 ,  4.472741,       nan],
       [      nan,       nan,       nan, 24.504238,       nan],
       [      nan,       nan,       nan,       nan, 14.214797],
       [      nan,       nan,       nan,       nan, 13.096626],
       [      nan,       nan,       nan,       nan,  3.268605],
       [      nan,       nan,       nan,       nan, 15.779201],
       [      nan,       nan,       nan,       nan, 25.41477 ]])
Coordinates:
  * x            (x) float64 18.94 37.88 56.83 75.77 ... 208.4 227.3 246.2 265.2
  * y            (y) float64 -78.0 -76.0 -74.0 -72.0 -70.0
    spatial_ref  int64 0
Attributes:
    transform:     (20.52061403508772, 0.0, 8.681798245614035, 0.0, 2.0, -79.0)
    grid_mapping:  spatial_ref
Example 2: If I use a clipping geometry with the same latitude at all points, then the clipping function throws an error even though the polygon is a box rather than a line:
geometries = [{'type': 'Polygon',
               'coordinates': [[[0,-70],[90,-70],[180,-70],[270,-70],[0,-70]]]}]
clipped = xda.rio.clip(geometries, crs='EPSG:4326')

Traceback (most recent call last):

  File "<ipython-input-9-65393bc57d6e>", line 3, in <module>
    clipped = xda.rio.clip(geometries, crs='EPSG:4326')

  File "/Users/jabadgeley/anaconda3/envs/py3_geospat/lib/python3.7/site-packages/rioxarray/rioxarray.py", line 1068, in clip
    _add_attrs_proj(cropped_ds, self._obj)

  File "/Users/jabadgeley/anaconda3/envs/py3_geospat/lib/python3.7/site-packages/rioxarray/rioxarray.py", line 140, in _add_attrs_proj
    src_data_array, new_data_array.rio.transform(recalc=True), None

  File "/Users/jabadgeley/anaconda3/envs/py3_geospat/lib/python3.7/site-packages/rioxarray/rioxarray.py", line 760, in transform
    src_bounds = self.bounds(recalc=recalc)

  File "/Users/jabadgeley/anaconda3/envs/py3_geospat/lib/python3.7/site-packages/rioxarray/rioxarray.py", line 716, in bounds
    src_resolution_x, src_resolution_y = self.resolution(recalc=recalc)

  File "/Users/jabadgeley/anaconda3/envs/py3_geospat/lib/python3.7/site-packages/rioxarray/rioxarray.py", line 647, in resolution
    "Only 1 dimenional array found. Cannot calculate the resolution."

OneDimensionalRaster: Only 1 dimenional array found. Cannot calculate the resolution.
Problem description
The clipped result from Example 1 includes only longitudes between 19 and 265 and latitudes between -70 and -78; however, the polygon encompasses all longitudes and all latitudes south of -70. I tried other polygons and polygons near the North Pole. So far I've found that the problem arises as long as the polygon's bounding box encompasses one of the poles. I found no issues when I tested the clipping function with polygons at mid-latitudes and the equator. I have not tested this with other coordinate systems.
Expected Output
The expected output for both examples is a new data array that includes all longitudes and all latitudes south of -70. The outputs from Examples 1 and 2 should only differ as to which values are 'nan'.
Environment Information
rioxarray (0.0.21) deps:
  rasterio: 1.0.21
    xarray: 0.11.3
      GDAL: 2.3.3

Other python deps:
     numpy: 1.15.4

System:
   Python version: 3.7.1 (default, Dec 14 2018, 13:28:58)  [Clang 4.0.1 (tags/RELEASE_401/final)]
   Operation System Information: Darwin-18.7.0-x86_64-i386-64bit
Installation method
conda
Conda environment information (if you installed with conda):
There are a lot more packages in my environment, but I think these are the relevant ones.
Environment (conda list):
gdal                      2.3.3            py37hbe65578_0
libgdal                   2.3.3                h0950a36_0
numpy                     1.15.4           py37hacdab7b_0
rasterio                  1.0.21           py37h9a122fd_0
rioxarray                 0.0.21                     py_0    conda-forge
xarray                    0.11.3                   py37_0
Details about
conda and system ( conda info ):
$ conda info
     active environment : py3_geospat
    active env location : /Users/jabadgeley/anaconda3/envs/py3_geospat
            shell level : 2
       user config file : /Users/jabadgeley/.condarc
 populated config files :
          conda version : 4.6.8
    conda-build version : 3.17.6
         python version : 3.7.1.final.0
       base environment : /Users/jabadgeley/anaconda3  (writable)
           channel URLs : https://repo.anaconda.com/pkgs/main/osx-64
                          https://repo.anaconda.com/pkgs/main/noarch
                          https://repo.anaconda.com/pkgs/free/osx-64
                          https://repo.anaconda.com/pkgs/free/noarch
                          https://repo.anaconda.com/pkgs/r/osx-64
                          https://repo.anaconda.com/pkgs/r/noarch
          package cache : /Users/jabadgeley/anaconda3/pkgs
                          /Users/jabadgeley/.conda/pkgs
       envs directories : /Users/jabadgeley/anaconda3/envs
                          /Users/jabadgeley/.conda/envs
               platform : osx-64
             user-agent : conda/4.6.8 requests/2.21.0 CPython/3.7.1 Darwin/18.7.0 OSX/10.14.6
                UID:GID : 501:20
             netrc file : None
           offline mode : False
Related to #58. Longitudes for the data and clipping geometry need to be from [-180, 180].
If I use a clipping geometry with the same latitude at all points, then the clipping function throws an error even though the polygon is a box rather than a line
This behavior is expected. You are creating a line if the latitude is the same along all of the points.
rio.clip_box is a workaround if you don't mind the data not being a valid raster.
Okay, I got the impression from here that the longitudes could be 0 to 360. I tried switching my longitudes to [-180,180], and I now the result has all the longitudes, but I still don't get the expected result for the latitudes:
Example 3
import numpy
import xarray
import rioxarray

numpy.random.seed(0)
temperature = 15 + 8 * numpy.random.randn(20,20)
lon = numpy.linspace(-179,180,20)
lat = numpy.linspace(-88,-50,20)

xda = xarray.DataArray(data=temperature,
                       dims=["x", "y"],
                       coords=dict(x=(["x"], lon),
                                   y=(["y"], lat)))
xda.rio.set_crs("EPSG:4326")

geometries = [{'type': 'Polygon',
               'coordinates': [[[180,-70],[90,-80],[0,-70],[-90,-70],[-180,-70]]]}]
clipped = xda.rio.clip(geometries, crs='EPSG:4326')

print(clipped)
<xarray.DataArray (x: 20, y: 5)>
array([[      nan,       nan,       nan,       nan, 18.284788],
       [      nan,       nan,       nan,       nan, 26.75487 ],
       [      nan,       nan,       nan,       nan, 13.298078],
       [      nan,       nan,       nan,       nan, 15.415563],
       [      nan,       nan,       nan,       nan, 23.435614],
       [      nan,       nan,       nan,       nan, 26.844118],
       [      nan,       nan,       nan,       nan, 18.259695],
       [      nan,       nan,       nan,       nan, 11.307323],
       [      nan,       nan,       nan,       nan, 17.535541],
       [      nan,       nan,       nan,       nan, 27.344117],
       [      nan,       nan,       nan,       nan, 14.214797],
       [      nan,       nan,       nan, 10.221471, 13.096626],
       [      nan,       nan, 23.636949,  8.493086,  3.268605],
       [      nan, 19.191128, 15.707377, 12.512911, 15.779201],
       [19.870751,  6.637973, 24.689162, 20.518545, 25.41477 ],
       [11.314242,  4.325932,  4.22626 , 20.550185, 13.723412],
       [      nan, 13.738664, 33.053788,  9.362398, 22.546086],
       [      nan,       nan, 16.253631, 19.628172, 17.797236],
       [      nan,       nan,       nan, 12.858132,  5.975909],
       [      nan,       nan,       nan,       nan, 16.313822]])
Coordinates:
  * x            (x) float64 -179.0 -160.1 -141.2 -122.3 ... 142.2 161.1 180.0
  * y            (y) float64 -78.0 -76.0 -74.0 -72.0 -70.0
    spatial_ref  int64 0
Attributes:
    transform:     (18.894736842105264, 0.0, -188.44736842105263, 0.0, 2.0, -...
    grid_mapping:  spatial_ref
Am I doing something wrong in this code?
As for Example 2, I would argue that a line that circles the globe does enclose an area. Is clip_box a workaround for this?
I gave simple examples above, but what I really want to do is to clip to a very complicated polygon - the coastline of Antarctica.
I would argue that a line that circles the globe does enclose an area.
The question is, which part does it include? The top or the bottom? How would the software know? One way to indicate this could be to add a tiny hole at the top of the polygon.
Is clip_box a workaround for this?
Potentially. You can give that a try. If that doesn't work, you can also try using the native selector in xarray: ds = ds.sel(x=slice(xmin,xmax),y=slice(ymax,ymin)) and then see if clip with drop=False does the masking properly or not.
what I really want to do is to clip to a very complicated polygon - the coastline of Antarctica.
You have chosen a particularly difficult region for this type of operation. I would recommend going to gis.stackexchange or the GDAL mailing list for some tips on how to handle this.
I would argue that a line that circles the globe does enclose an area.
The question is, which part does it include? The top or the bottom? How would the software know? One way to indicate this could be to add a tiny hole at the top of the polygon.
How does the software currently decide what is the inside and outside of a polygon drawn on the Earth's surface? I don't see how drawing a circle along a latitude band is different than drawing a circle around North America.
You have chosen a particularly difficult region for this type of operation. I would recommend going to
gis.stackexchangeor the GDAL mailing list for some tips on how to handle this.
Thanks, I'll do that.
How does the software currently decide what is the inside and outside of a polygon drawn on the Earth's surface? I don't see how drawing a circle along a latitude band is different than drawing a circle around North America.
A helpful way to look at your geometry is shapely.
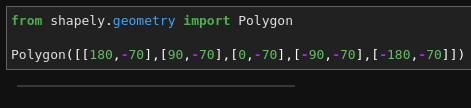
This is the input you are putting in:
from shapely.geometry import Polygon

Polygon([[180,-70],[90,-70],[0,-70],[-90,-70],[-180,-70]])
This creates a line:
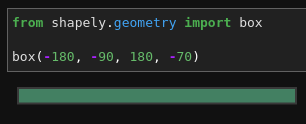
It might be more helpful to look at it as a bounding box with a minimum x, minimum y, maximum x, maximum y instead of a circle around the top of the world due to the nature of the geographic coordinates.
from shapely.geometry import box

box(-180, -90, 180, -70)
This creates a polygon:
If you use that polygon in the clip operation:
geometries = [box(-180, -90, 180, -70)]
clipped = xda.rio.clip(geometries, crs='EPSG:4326')
You get:
<xarray.DataArray (x: 20, y: 9)>
array([[29.11241877, 18.20125767, 22.82990387, 32.92714559, 29.94046392,
         7.18177696, 22.60070734, 13.78914233, 14.17424919],
       [-5.42391853, 20.22894876, 21.91548959,  9.06267984, 33.15803699,
         3.3650746 , 15.36606814, 13.5025292 , 27.26223371],
       [ 6.61157628,  3.6398565 ,  1.34983847, 30.60620316, 10.92278255,
        11.49540559,  4.97763712, 21.21992285,  2.08881722],
       [ 9.62031642, 12.12357471,  8.49482974,  1.18973918, 16.41940914,
        11.78575251,  1.95841322, 18.70225804,  7.74161308],
       [ 5.67880127, 22.2066119 , 18.72529952,  2.71005051, 26.90601755,
        30.16711341, 24.43023657, 13.56060131,  6.43397903],
       [30.06520558,  4.21792751,  4.83612001, 22.75517367,  5.61501276,
        30.54896949, 11.69104815,  9.02036151, 30.38353621],
       [18.01140425,  6.20479368, 17.38590539, 25.61108717,  9.44345712,
        13.80292368, 11.51877159, 29.79410983, 20.37835806],
       [ 3.06993926, 18.51513361, 16.33338796, 20.0802515 , 34.0651582 ,
        22.5558359 ,  7.6974222 , 23.9361303 ,  4.47274072],
       [11.01574039, 30.43625643, 22.59536646, 15.70040993,  5.19651585,
        21.75490381,  6.99827722,  2.64183123, 24.50423834],
       [12.16804871,  4.00038965,  9.85105278, -2.78722522, 20.00185161,
         2.18353876,  6.16493328, 15.41732063,  9.08349603],
       [12.0465453 , 13.08496658, 23.79727677, 20.24210985, 20.12105221,
         2.06435165, 14.805391  ,  9.09575273, 17.23939679],
       [ 7.35244   , 12.23214579, 11.2912322 , 18.85185179,  2.67362388,
        15.50609595, 16.2520523 , 16.85744829, 10.22147145],
       [ 9.9005038 , 11.82182549, 13.93695538, 12.61767296, 12.52789625,
         1.59196955, 24.21865252, 23.63694874,  8.49308593],
       [ 5.48912594, 10.94546917, 10.22948769, 14.57946163, -0.49023845,
        16.51022877, 19.19112819, 15.7073767 , 12.51291063],
       [14.11567474, 23.16138169,  9.46360122, 27.29101643, 17.29074951,
        19.87075068,  6.63797307, 24.68916232, 20.51854532],
       [ 4.54778519, 28.26504544, 14.05468764,  9.55857437, 20.33106466,
        11.3142417 ,  4.32593223,  4.22625995, 20.55018522],
       [ 9.24316489,  8.49605609, 17.19613086,  7.87267934,  5.74115793,
        12.50166199, 13.73866387, 33.05378798,  9.36239779],
       [23.54807519, 11.37291357,  9.49729911,  5.28738078, 11.47261894,
        12.75715604, 12.08245164, 16.25363084, 19.62817198],
       [20.58765719, 15.03016711, 22.45478699, 17.71971987, 14.87454311,
        16.28742535, 13.47477205, 11.84120389, 12.8581317 ],
       [ 1.41515344, 18.0982438 , -3.04451384,  6.81994525, 15.30904441,
         1.74627918,  7.1159141 ,  3.22531994, 28.18507946]])
Coordinates:
  * x            (x) float64 -179.0 -160.1 -141.2 -122.3 ... 142.2 161.1 180.0
  * y            (y) float64 -88.0 -86.0 -84.0 -82.0 ... -78.0 -76.0 -74.0 -72.0
    spatial_ref  int64 0
Attributes:
    grid_mapping:  spatial_ref
This should behave similar to:
xda.rio.clip_box(-180, -90, 180, -70)
<xarray.DataArray (x: 20, y: 10)>
...
Coordinates:
  * x            (x) float64 -179.0 -160.1 -141.2 -122.3 ... 142.2 161.1 180.0
  * y            (y) float64 -88.0 -86.0 -84.0 -82.0 ... -76.0 -74.0 -72.0 -70.0
    spatial_ref  int64 0
Attributes:
    grid_mapping:  spatial_ref
For a more complex geometry, you might need to perform antimeridian cutting. Ref: https://github.com/Toblerity/Shapely/pull/95.
Hopefully this is helpful.
Yes, that gives me more context, but I still don't fully understand why the clipping doesn't work for the geometry in my first example.
I still don't fully understand why the clipping doesn't work for the geometry in my first example.
EPSG: 4326 goes from -180 to 180 in the longitude range. You can see the bounds here:
>>> import pyproj
>>> pyproj.CRS("EPSG:4326")
<Geographic 2D CRS: EPSG:4326>
Name: WGS 84
Axis Info [ellipsoidal]:
- Lat[north]: Geodetic latitude (degree)
- Lon[east]: Geodetic longitude (degree)
Area of Use:
- name: World.
- bounds: (-180.0, -90.0, 180.0, 90.0)
Datum: World Geodetic System 1984
- Ellipsoid: WGS 84
- Prime Meridian: Greenwich
Your longitude went from 0-360, so you needed to adjust it to match the projection (#58).
I tried to fix the longitudes in my first reply (now labeled Example 3 above). It's a synthetic example, so I just changed the longitudes to be [-180,180] rather than [0,360] for both the data and the polygon. For my real data, I understand that I'll have to do something more like this: lon = (lon + 180) % 360 - 180. Example 3 shows that switching the longitude bounds fixes only part of the problem with the output - the latitudes still do not extend to -90 and if you plot the result, the clipped data lies outside the polygon:
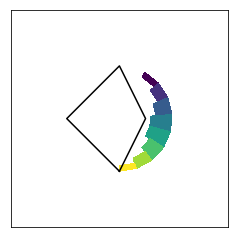
The clipping polygon in Example 3 doesn't appear to be what you are wanting it to be:
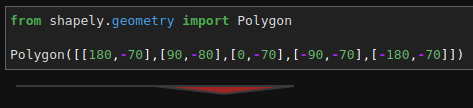
Okay, thanks, I think I get it. The clip doesn't look like what I want because shapely views the world as a flat rectangle rather than a sphere. So if I can get my polygon to look correct with shapely, then presumably the rioxarray clip should give me the result I'm looking for. Here's the Antarctic coastline according to shapely:
from shapely.geometry import Polygon
Polygon(cl_coords)
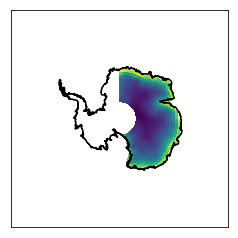
 Where cl_coords are the coastline coordinates. I've fixed the longitudes to be [-180,180], so the clip works better than before, but it's still not correct because it ignores the most southern latitudes. Here's what the clip looks like when I plot it with a South Pole Stereographic projection:
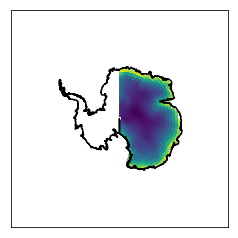
I have now edited cl_coords at longitude 180 (the 'end' of the Earth according to shapely) by adding the coordinates [179.995001,-90] and [180.001, -90] so that the line that connects the ends of the map runs along the latitude -90. Now when I plot with shapely, I get this:

I had hoped that this would solve my clipping problem, and it mostly does, but now it looks like my main problem may have to do with the dateline. Here's what the clip looks like when I plot it with a South Pole Stereographic projection:
I will look more at the resources you provided to see if I can fix the dateline problem.
You could try re-projecting to the South Pole Stereographic projection and then clipping.
Yes, if I project the polygon and the data into EPSG:3031, then I can get the polygon to clip just fine. @snowman2 Thanks for your help.
@jabadge can you give me some hint/tips on how you solved your issue? I'm on a similar situation here discussion #278 . I'm trying to clip shapefiles of drainage basins from Antartica...
@carocamargo I'm not sure how much this will help you with your drainage basin shapefiles, but here's what worked for me for all of Antarctica:
import pandas as pd
import xarray as xr
import rioxarray

# Open netCDF file
ds = xr.open_dataset('file.nc')
# Convert longitudes to -180 to 180
ds.lon.values = (((ds.lon.values + 180) % 360) - 180)
# Order longitudes (I don't remember if this is actually necessary)
ds = ds.sortby('lon')

# Read in the coordinates file.
# The first column is longitude and the second is latitude.
df = pd.read_csv('file_with_coordinates.txt', sep="\t", header=None)
# Convert longitudes from 0 to 360 to -180 to 180
df[0] = (df[0] + 180) % 360 - 180
# Edit first and last longitudes to extend beyond the longitude limits.
# This ensures that the clipping captures the 180/-180 longitude
df[0][0] = -181
df[0][1] = -181
df[0][df.index.get_values().max()-1] = 181
df[0][df.index.get_values().max()] = 181
# Convert the dataframe to a list
coords = df.values.tolist()
# Build the geometries object
geometries = [{'type': 'Polygon','coordinates': [coords]}]

# Define a function to clip to the geometry
def clip(values, lats, lons, geometries):
    # I create a xr.DataArray rather than passing in the xr.Dataset so that the clip is more likely to work.
    xda = xr.DataArray(data=values, dims=["y", "x"], coords=dict(y=(["y"], lats), x=(["x"], lons)))
    # Set the projection
    xda.rio.set_crs("EPSG:4326")
    # Clip
    xda_clipped = xda.rio.clip(geometries, crs="EPSG:4326")
    return xda_clipped

# Run the clip function
ds_clipped = clip(ds['variable'].values, ds['lat'].values, ds['lon'].values, geometries)
You'll notice that I didn't project to South Pole Stereographic. I found that the clip works for either projection, but if I projected to South Pole Stereographic, then I had trouble projecting back to WGS84.
My coordinates file has the following properties:
- longitudes range from 0 to 360
- the coordinates are ordered so the longitudes start at 180 and end at 179.995
- the first and last coordinates have latitudes that extend beyond -90 to ensure the pole is included in the clip.
Here are the first and last few lines of my coordinates file: 180 -100 180 -84.3563 180.007 -84.3563 180.007 -84.3575 180.019 -84.3575 180.019 -84.3586 180.03 -84.3586 ... 179.995 -84.3517 179.995 -84.3529 179.995 -84.354 179.995 -84.3552 179.995 -84.3563 179.995001 -84.3563 179.995001 -100
Thanks @jabadge it actually helped :)