issue-tracking
 issue-tracking copied to clipboard
Adding second metric to line chart with aggregation crashes dashboard
Describe the Bug
In Comet UI, when using a line chart to plot a single metric with grouping enabled (mean aggregation, Std Dev range; see photo 1), adding a second metric in the y-axis immediately crashes the dashboard (see photo 2).
Expected behavior
No crash
Where is the issue?
- [ ] Comet Python SDK
- [X] Comet UI
- [ ] Third Party Integrations (Huggingface, TensorboardX, Pytorch Lighting etc)
To Reproduce
Steps to reproduce the behavior (Comet UI):
- Create a panel with a line chart for a single metric in the y-axis
- Enable grouping and select "Mean" for "Aggregation" and "Std Dev" for "Range"
- Click Done to finish editing the panel
- Edit the same panel again, select a second metric to add to y-axis (photo 1). As soon as the metric is selected, observe a dashboard crash (photo 2)
Stack Trace
N/A
Comet Debug Log
N/A
Screenshots or GIFs
Photo 1:
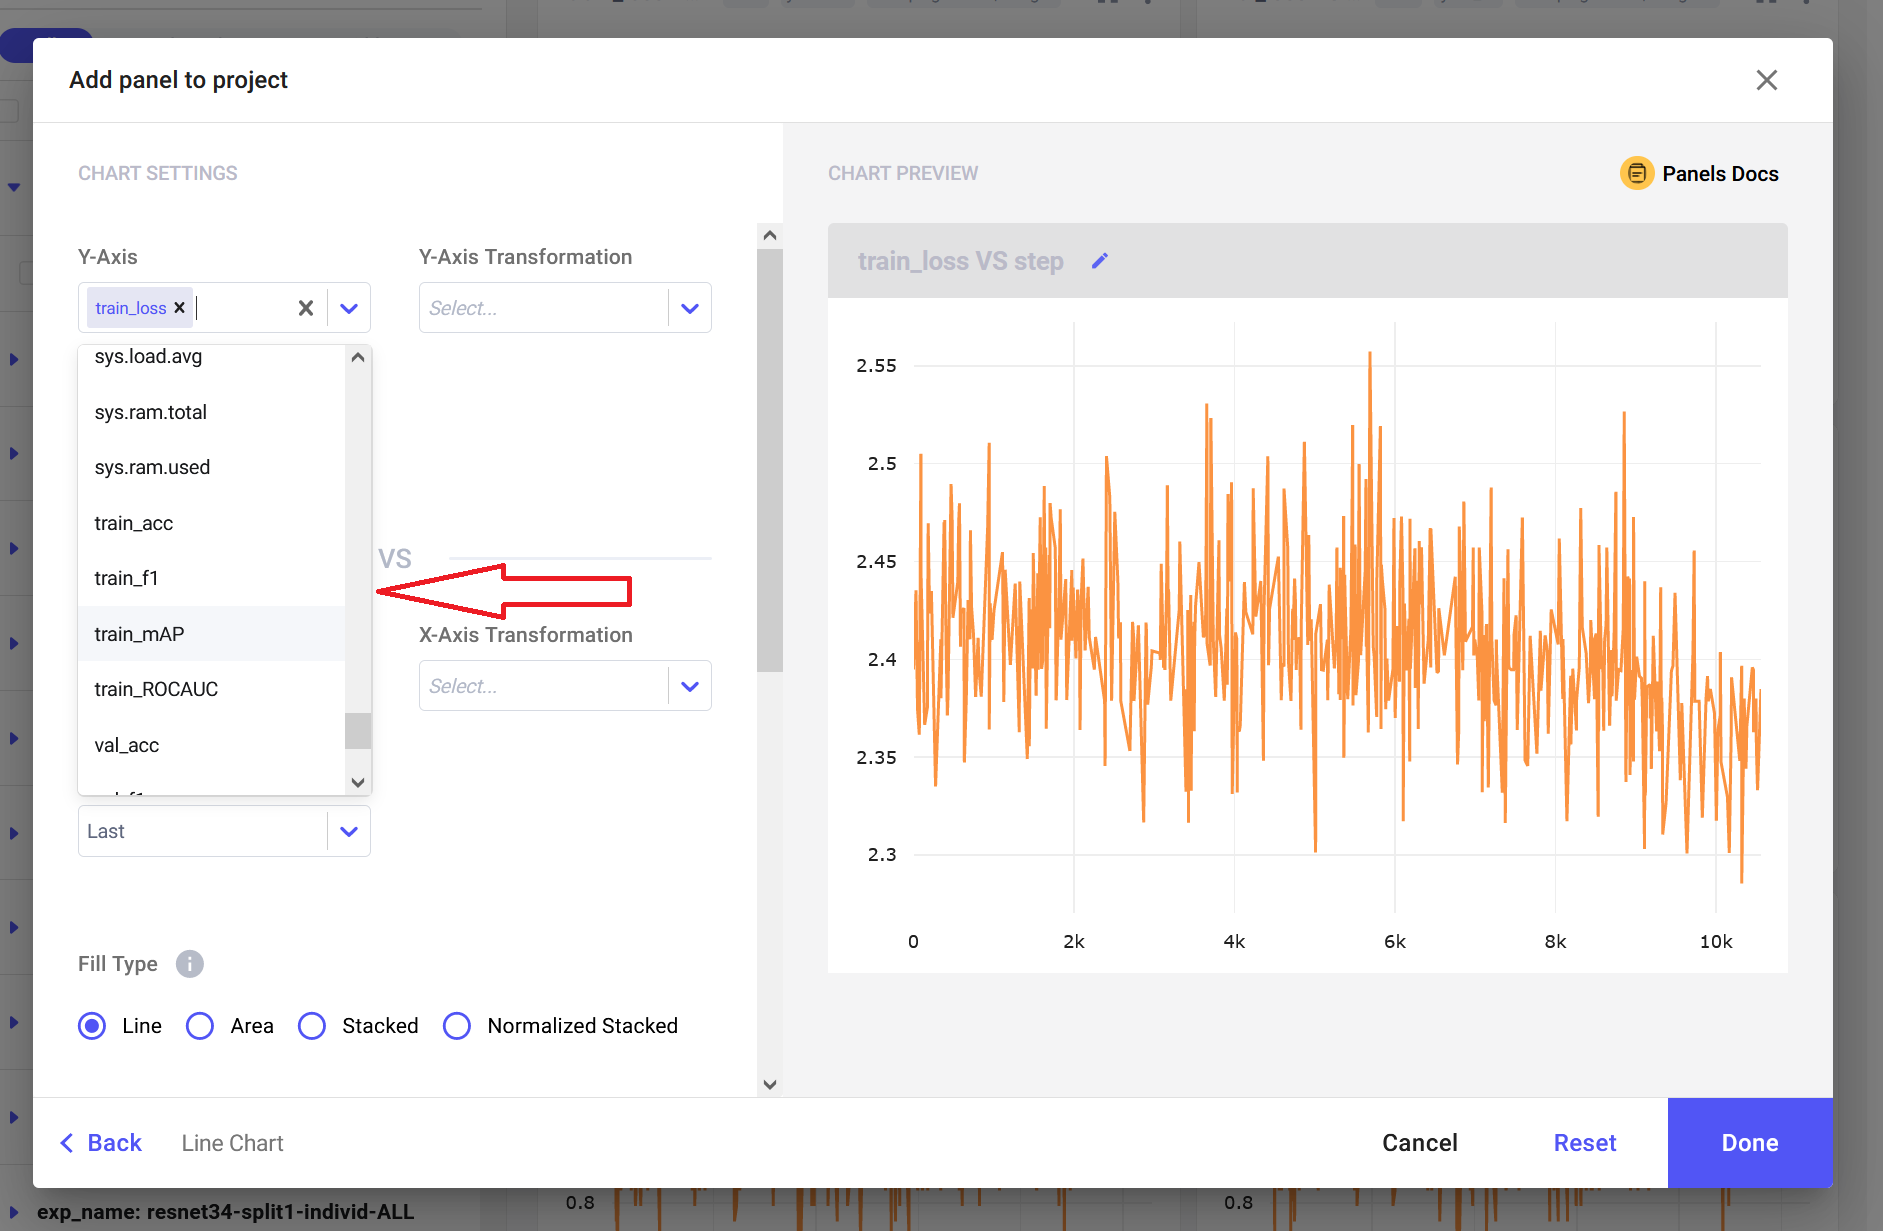 Photo 2:

Link to Comet Project/Experiment
Can provide if helps later on
Additional context
N/A
Tried first adding multiple metrics, then enabling grouping. Mean aggregation worked fine, but enabling Std Dev range caused the crash.
Hi @kirillv-cim I was able to reproduce this issue. I've raised a ticket with our engineering team to look into this. I will update you when we have a fix ready.
This issue is stale because it has been open 30 days with no activity. Remove stale label or comment or this will be closed in 5 days.
This issue was closed because it has been stalled for 5 days with no activity.