colour

colour copied to clipboard
Spectral locus colours doesn't support "RGB" argument in the "colour.plotting.volume" module.
As per @KelSolaar, adding this here to keep track of.
The plotting library is approximately two years old now, and it is possible that some regressions have appeared. It seems that when issuing certain functionality that works fine in 2D, the 3D equivalents are lost.
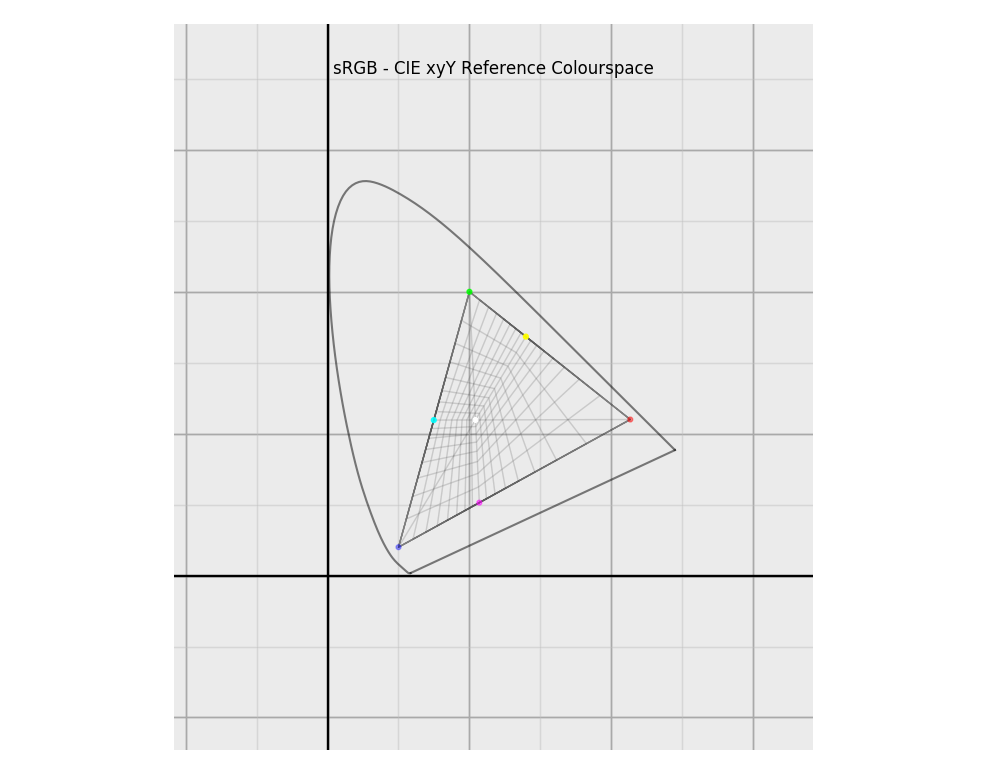
For example:
myplot = plotting.plot_RGB_scatter(
    RGB, "sRGB",
    reference_colourspace="CIE xyY",
    show_spectral_locus=True,
    show_diagram_colours=True,
    spectral_locus_colours="RGB",
    standalone=False,
)
In this case, the spectral locus appears as solid black: