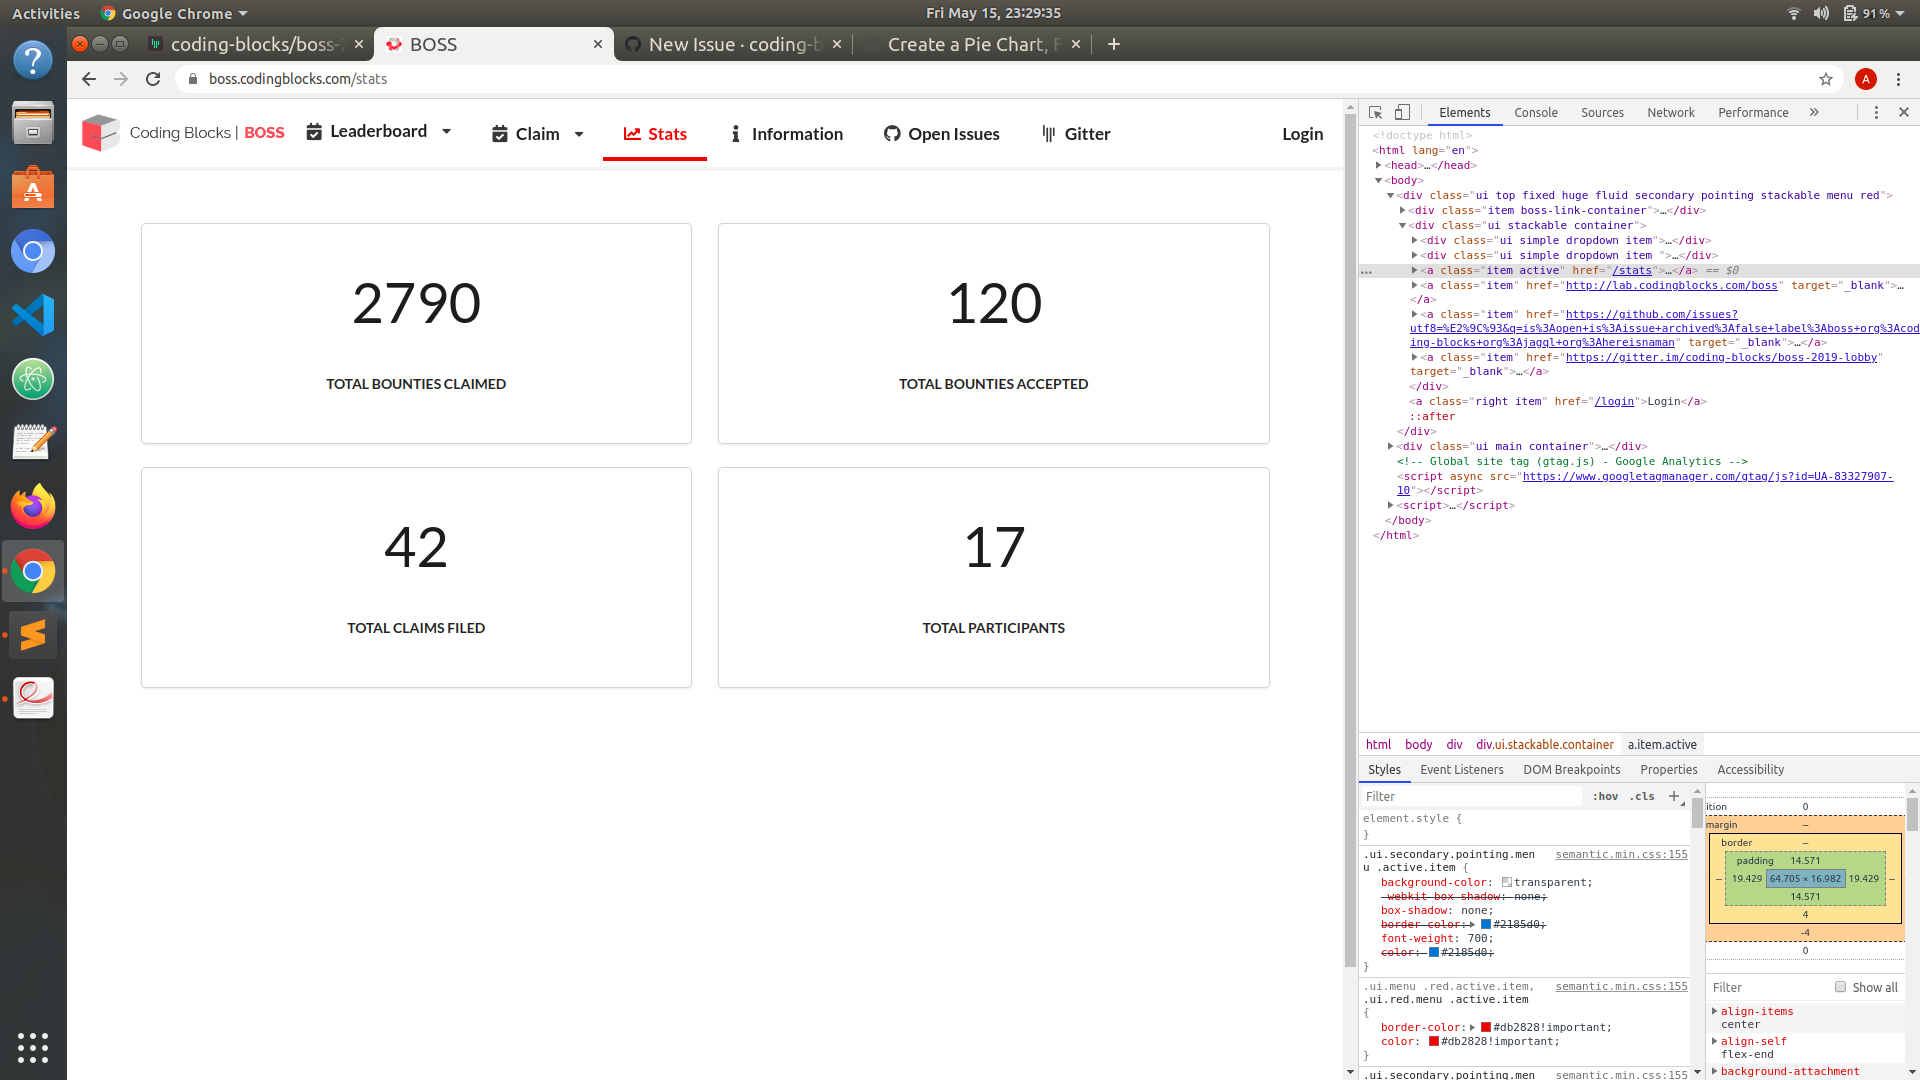
UI for Stats
The stats UI is is very basic. We can add charts to make it look attractive to users.
@mnb27 The Idea is good. Can you also list down what different types of stats we can show here. Also for charts, we can use https://www.chartjs.org/
@abhishek97 Stas like:- TOP 3 winners (hall of fame kind of) each year FOOTFALLS PARTICIPATION YEAR BY YEAR ISSUES RAISED AND SOLVED TOTAL BOUNTIES CLAIMED TOTAL BOUNTIES ACCEPTED TOTAL CLAIMS FILED
All description will be through charts.
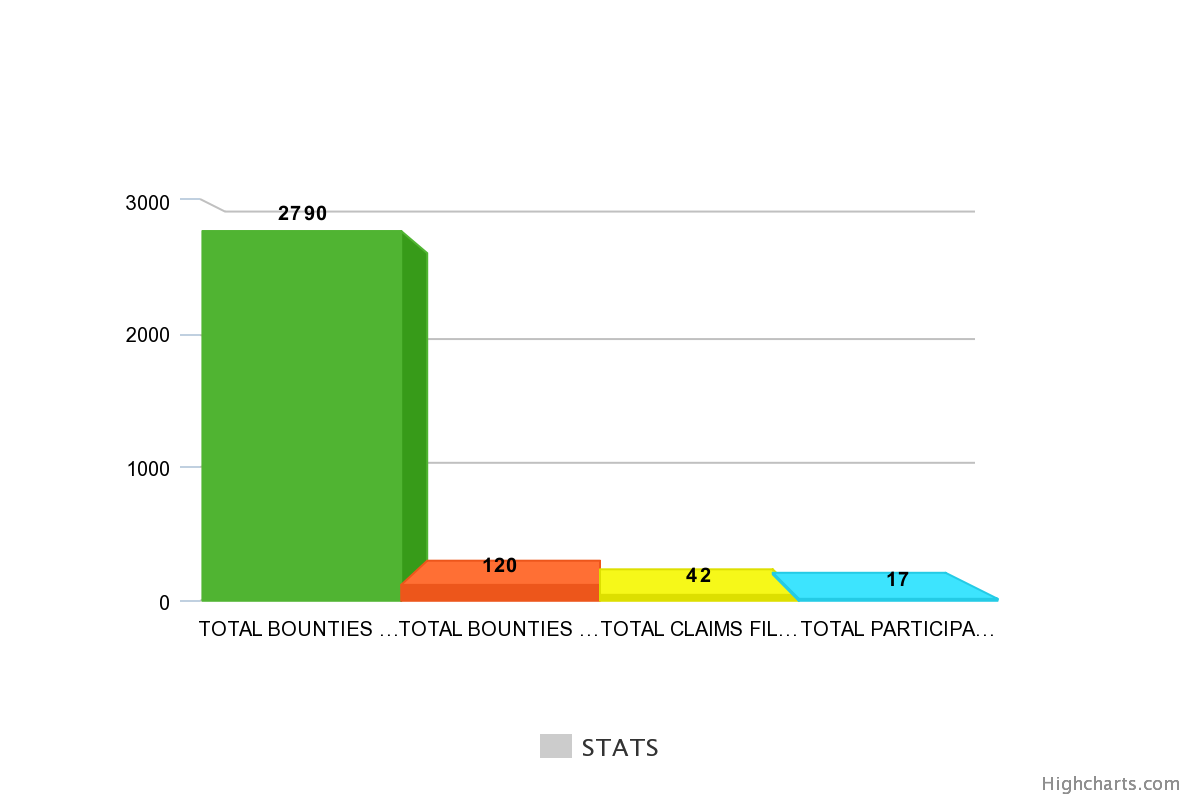
I have a doubt, what's the benefit of visually comparing these four values? they're all independent.
@YashKumarVerma Not all stats are independent. We can show participants year wise, issues raised yearwise etc..Currently stats are not shown yearwise. @abhishek97 What's your say ?