MOD: Making data visualization more useful
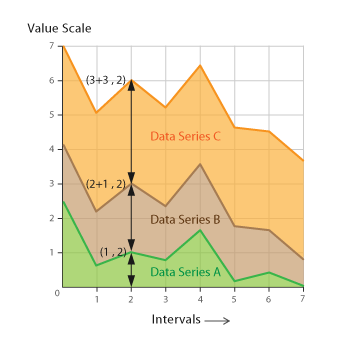
We should consider changing the type of graph to a "stacked area graph" that combines the client's income as well as all benefit programs.
see: http://www.datavizcatalogue.com/methods/stacked_area_graph.html
I think this question is now for @anhase and the Project Hope folks to tell us the kind of feedback they want to be able to show clients and/or investors (of whatever flavor).
Here's what Kristin had to say yesterday: "As for the final results page, I think the graph you guys have was probably an attempt to mimic the graph on page 17 of this CSP document: https://www.umb.edu/editor_uploads/images/centers_institutes/center_social_policy/Rock_and_a_Hard_Place_Sept_2016.pdf. I agree that it's difficult to read. I think there are 2 different data visualizations that would be helpful to have if they're not too difficult to develop. One would be a "before" and "after" bar graph very similar to the table you guys have, where the y axis represents total net resources (income + benefits) and there is 1 bar for "before" and 1 bar for "after." Each bar would consist of 2 subsections: earned income (in 1 color) and benefits (in another color). The second visualization that might be helpful is just some indication of where the family's new/proposed income lies in relation to the eligibility drop-offs for each benefit. I'm picturing something almost like a timeline (you're HERE; you'll no longer be eligible for Section 8 HERE; you'll no longer be eligible for SNAP HERE)."
On Sat, Dec 9, 2017 at 2:33 PM, knod [email protected] wrote:
I think this question is now for @anhase https://github.com/anhase and the Project Hope folks to tell us the kind of feedback they want to be able to show clients and/or investors (of whatever flavor).
— You are receiving this because you were mentioned. Reply to this email directly, view it on GitHub https://github.com/codeforboston/cliff-effects/issues/41#issuecomment-350500100, or mute the thread https://github.com/notifications/unsubscribe-auth/AD-0zR2vF904Zoj53Hppv4Fnkuj6q7pQks5s-uBzgaJpZM4PdOPs .
Ah, ok, so the first is like the stacked bar chart I had talked about, but only for the two given values. The second one, though, sounds like the graph we have except for with a 'you are here' marker. It shows where the benefit fall to 0. Does that sound right? Do you think she wants them separated out into a graph for each program? Or does she mean something else?
I'm not sure how difficult they are to develop. @sashamaryl has had a look at chart.js, etc., and might have a better idea.
@anhase: Or are you just talking about having a number value. 'You would lose SNAP at income of $500/month'.
We can do both of these. For the second one I think she’s picturing something like a number line, with flags/labels pointing to the relevant dollar amounts. Rather than a full-on graph, it’s a representation of a few data points along one dimension. We will be saying “at 500 you lose snap” but more importantly we will be giving them a visual representation of where they are in relation to that amount.
Will or Liani, do you want to/have time to design it out? I’ll start working on the basic structure.
A lot has changed. We're going to alter the way the final graphs are accessed (may remove them for now) and keep the bar graphs. Current question is whether we should:
- Allow creation of multiple future predictions.
- Hide the part of the income that's not relevant (show top 10%) to make differences more apparent.