benchmark-operator
 benchmark-operator copied to clipboard
fio benchmark - Grafana dashboard shows nothing
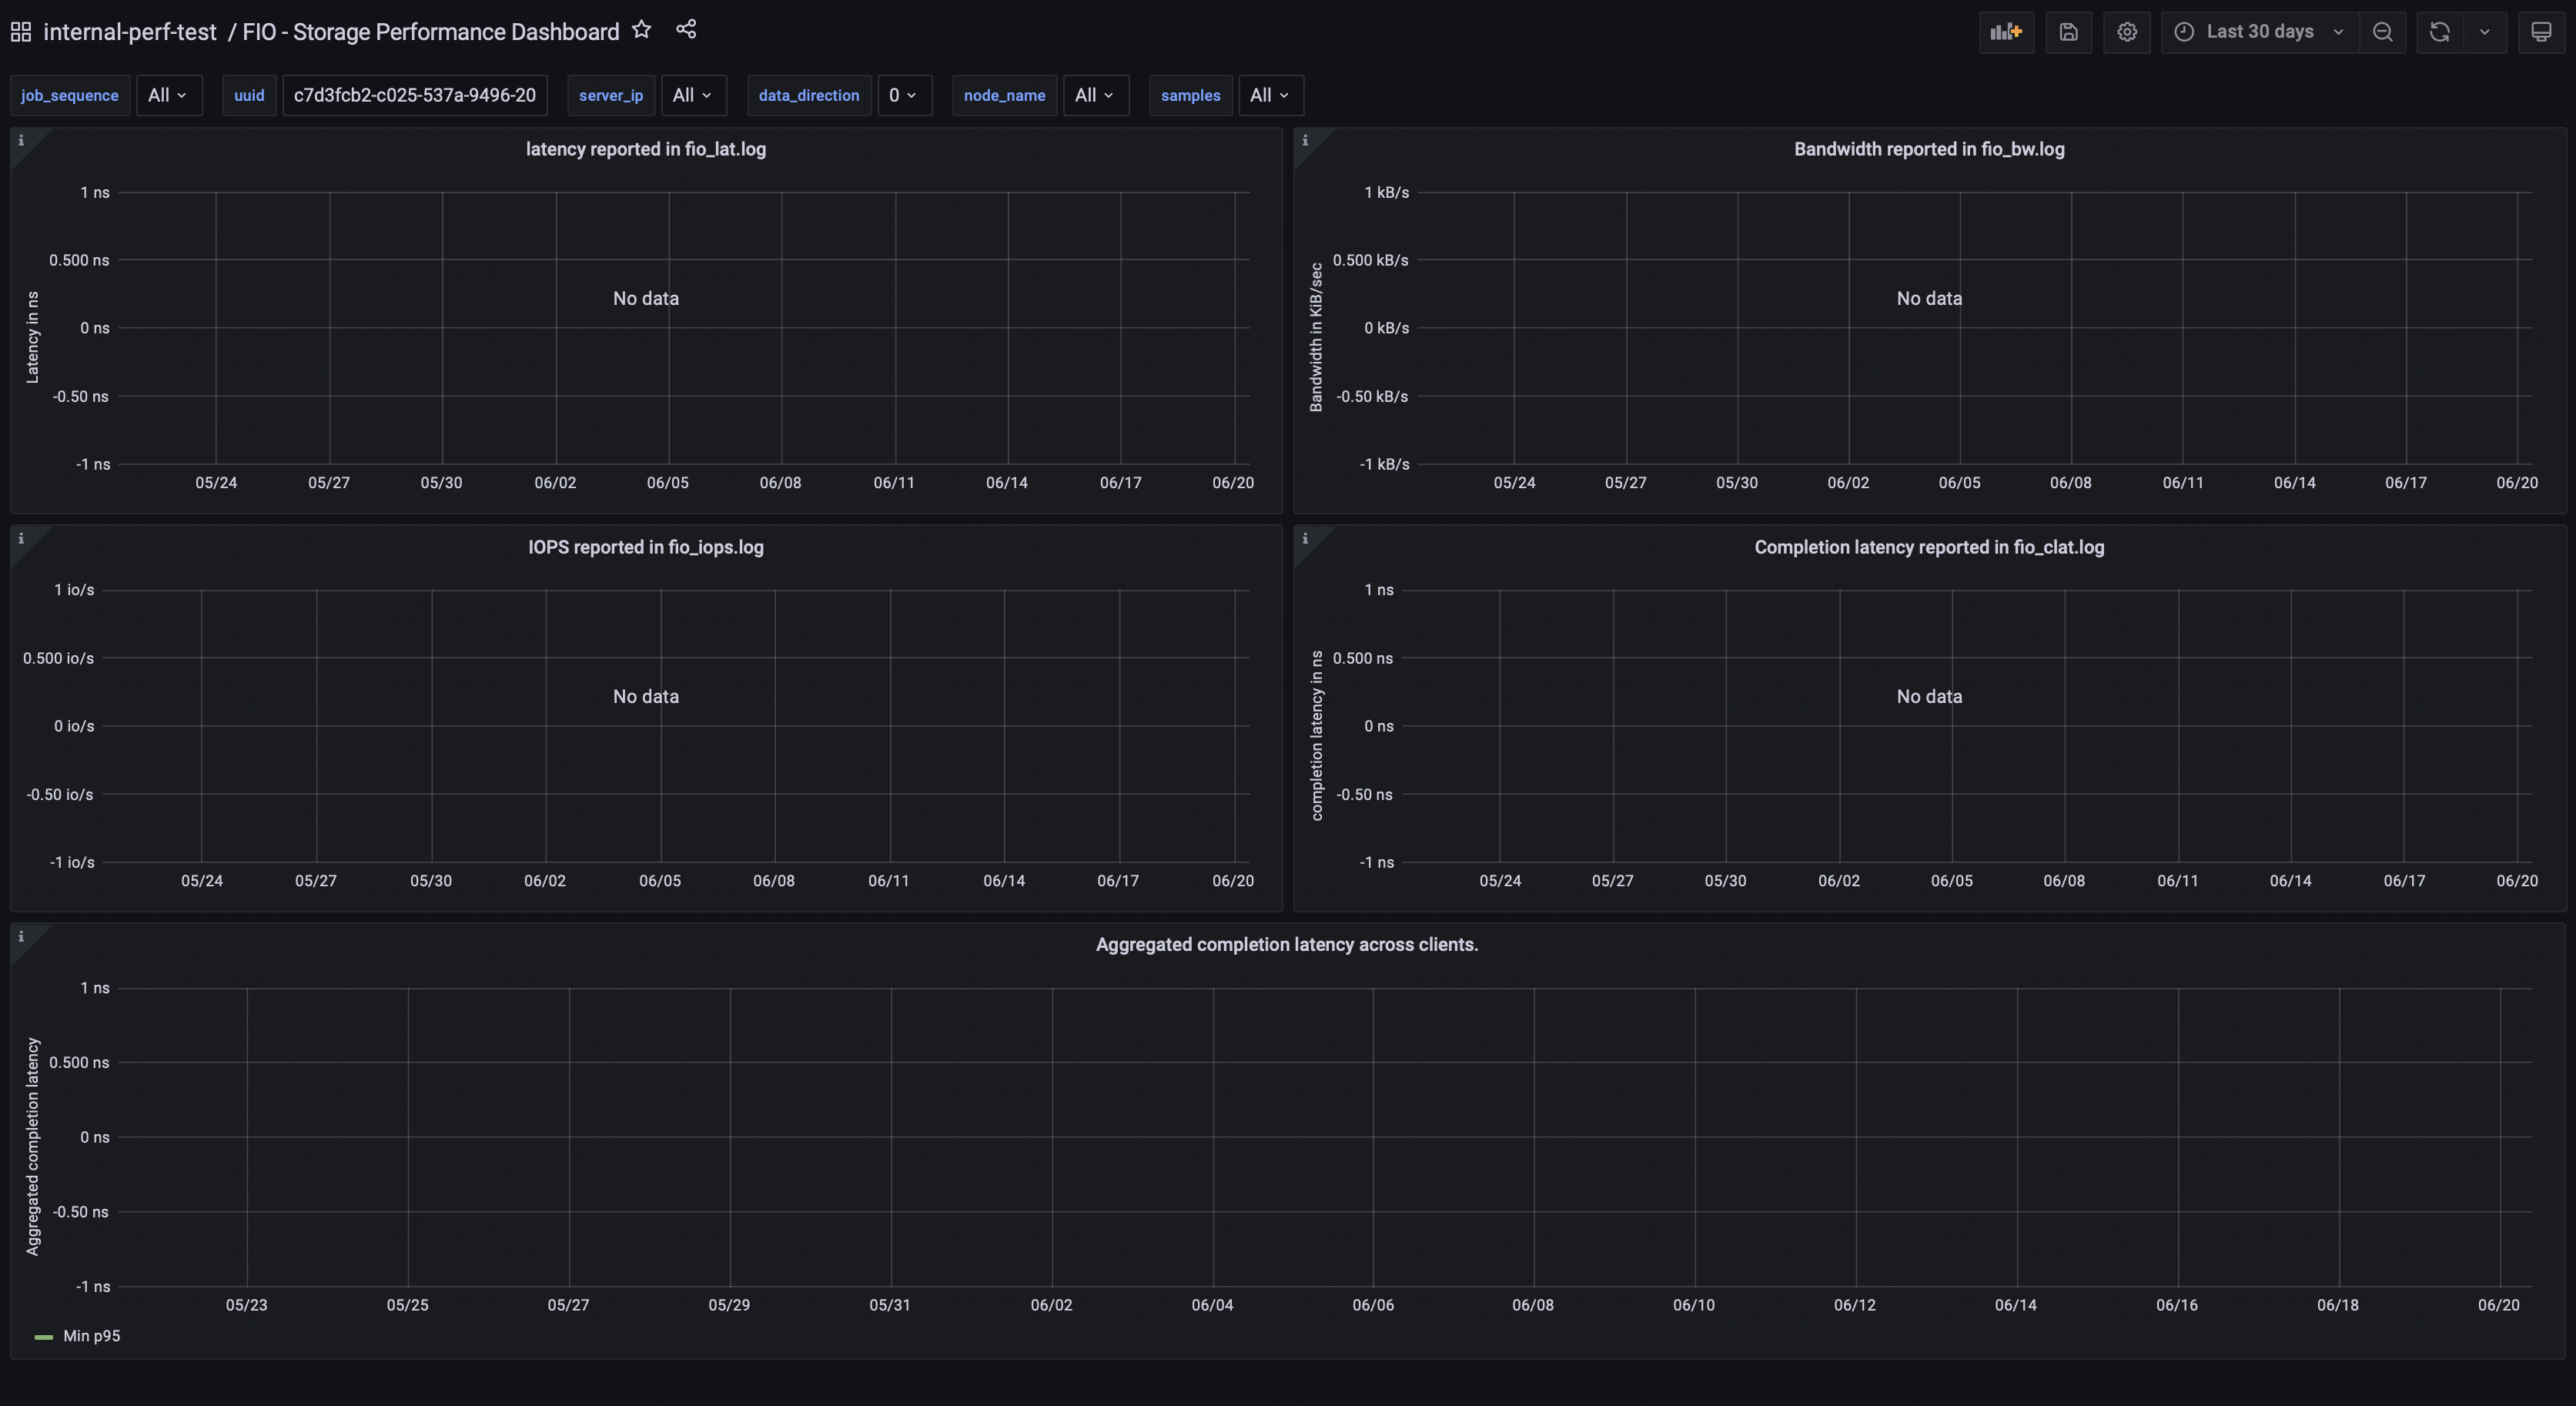
Describe the bug Grafana dashboard shows "No data" and graphs are not printed.
To Reproduce Steps to reproduce the behavior:
OpenShift version: 4.9.29 Elasticsearch (ECK) operator version: 2.2.0 Grafana operator version: 4.4.1 Grafana datasource index: ripsaw-fio-logs Grafana datasource Time field: time_ms Grafana dashboard: https://github.com/cloud-bulldozer/arsenal/blob/master/fio-distributed/grafana/6.3.0/dashboard.json ripsaw-fio-logs Index template:
{ "index_patterns" : "ripsaw-fio-log*", "priority" : 0, "template": { "mappings": { "properties": { "time_ms": { "type": "date" } } } } }
Expected behavior Grafana is able to print graphs based on input data.
Screenshots
If applicable, add screenshots to help explain your problem.
Additional context I do not see field "time_ms" in data from ripsaw-fio-logs index:
{ "_index": "ripsaw-fio-log", "_id": "d3ef4a953ba6feb6d9cc1df940924d0319e951d0211fb3c821e541e5d253b98c", "_version": 1, "_score": 1, "_source": { "uuid": "cb60f273-8d81-508a-9aa6-67d769847957", "user": "ripsaw", "host": "10.131.0.95", "cluster_name": "myk8scluster", "job_number": 1, "fio-version": "fio-3.27", "job_options": { "rw": "randread", "time_based": "1", "runtime": "20", "ramp_time": "5" }, "job_name": "randread", "log_file": "/tmp/fiod-cb60f273-8d81-508a-9aa6-67d769847957/fiojob-randread-64KiB-1/3/randread/fio_lat.1.log.10.131.0.95", "sample": 3, "log_name": "lat", "timestamp": 1655293208000, "date": "2022-06-15T11:40:08.000000Z", "latency": 750970, "data_direction": "read", "block_size": 0, "offset": 0, "global_options": { "directory": "/mnt/pvc", "filename_format": "f.\$jobnum.\$filenum", "write_bw_log": "fio", "write_iops_log": "fio", "write_lat_log": "fio", "log_avg_msec": "3000", "clocksource": "clock_gettime", "kb_base": "1000", "unit_base": "8", "ioengine": "libaio", "size": "1GiB", "bs": "64KiB", "iodepth": "4", "direct": "1", "numjobs": "1" }, "run_id": "NA" }, "fields": { "cluster_name.keyword": [ "myk8scluster" ], "date": [ "2022-06-15T11:40:08.000Z" ], "job_options.runtime.keyword": [ "20" ], "global_options.write_bw_log.keyword": [ "fio" ], "job_options.rw.keyword": [ "randread" ], "global_options.iodepth.keyword": [ "4" ], "job_options.time_based.keyword": [ "1" ], "global_options.write_iops_log": [ "fio" ], "uuid": [ "cb60f273-8d81-508a-9aa6-67d769847957" ], "user.keyword": [ "ripsaw" ], "global_options.size": [ "1GiB" ], "log_name.keyword": [ "lat" ], "global_options.numjobs": [ "1" ], "global_options.unit_base.keyword": [ "8" ], "log_file.keyword": [ "/tmp/fiod-cb60f273-8d81-508a-9aa6-67d769847957/fiojob-randread-64KiB-1/3/randread/fio_lat.1.log.10.131.0.95" ], "log_file": [ "/tmp/fiod-cb60f273-8d81-508a-9aa6-67d769847957/fiojob-randread-64KiB-1/3/randread/fio_lat.1.log.10.131.0.95" ], "host": [ "10.131.0.95" ], "job_number": [ 1 ], "host.keyword": [ "10.131.0.95" ], "global_options.directory.keyword": [ "/mnt/pvc" ], "offset": [ 0 ], "log_name": [ "lat" ], "job_options.rw": [ "randread" ], "global_options.log_avg_msec": [ "3000" ], "global_options.write_lat_log": [ "fio" ], "global_options.clocksource.keyword": [ "clock_gettime" ], "global_options.numjobs.keyword": [ "1" ], "global_options.log_avg_msec.keyword": [ "3000" ], "global_options.kb_base": [ "1000" ], "global_options.bs.keyword": [ "64KiB" ], "global_options.direct.keyword": [ "1" ], "job_options.ramp_time": [ "5" ], "job_options.runtime": [ "20" ], "global_options.filename_format.keyword": [ "f.\$jobnum.\$filenum" ], "global_options.write_iops_log.keyword": [ "fio" ], "latency": [ 750970 ], "uuid.keyword": [ "cb60f273-8d81-508a-9aa6-67d769847957" ], "global_options.clocksource": [ "clock_gettime" ], "global_options.filename_format": [ "f.\$jobnum.\$filenum" ], "run_id.keyword": [ "NA" ], "fio-version.keyword": [ "fio-3.27" ], "global_options.direct": [ "1" ], "global_options.iodepth": [ "4" ], "block_size": [ 0 ], "timestamp": [ 1655293208000 ], "cluster_name": [ "myk8scluster" ], "fio-version": [ "fio-3.27" ], "run_id": [ "NA" ], "data_direction": [ "read" ], "data_direction.keyword": [ "read" ], "global_options.ioengine.keyword": [ "libaio" ], "job_options.ramp_time.keyword": [ "5" ], "sample": [ 3 ], "global_options.size.keyword": [ "1GiB" ], "global_options.unit_base": [ "8" ], "global_options.write_bw_log": [ "fio" ], "job_options.time_based": [ "1" ], "global_options.kb_base.keyword": [ "1000" ], "global_options.bs": [ "64KiB" ], "global_options.ioengine": [ "libaio" ], "job_name": [ "randread" ], "job_name.keyword": [ "randread" ], "global_options.write_lat_log.keyword": [ "fio" ], "global_options.directory": [ "/mnt/pvc" ], "user": [ "ripsaw" ] } }
I've been facing the same issue as this. One of the actual indices generated by fio is ripsaw-fio-log but not ripsaw-fio-logs, so I think the explanation is not correct at least. https://github.com/cloud-bulldozer/benchmark-operator/blob/master/e2e/010-fio.bats#L7
$  oc rsh elasticsearch-es-default-0  curl -u "elastic:${PASSWORD}" -k "https://elasticsearch-es-http:9200/_cat/indices?v"
health status index                             uuid                   pri rep docs.count docs.deleted store.size pri.store.size
green  open   ripsaw-fio-log                    3S1cwm_xQ86ocp2NRZ3xbw   1   1        648            0    614.1kb          307kb
green  open   ripsaw-fio-results                FGF2HvJLTbKk6nIw1eymcg   1   1         24            0    866.1kb          433kb
green  open   ripsaw-fio-get_prometheus_trigger dFtzJaXtTwmqtVWOFGKIaA   1   1         24            0    285.5kb        142.7kb
green  open   ripsaw-fio-analyzed-result        OlEAMDDFT3yzZnqLNXNSMw   1   1         24            0    101.7kb         50.8kb
I've changed the index name in Grafana datasource to ripsaw-fio-log, so it is aligned with the index name now. Unfortunately I sill do not see any data in a dashboard. According documentation, "time_ms" should be set as "Time filed name" in Grafana datasource. But when I have a look to the index entries, I do not see it.
Example of one entry from the index:
{
  "_index": "ripsaw-fio-log",
  "_id": "0d24f8d625f6cbb87c25cbf7b8100709aee0638ade8f551769eba0fcc445a68d",
  "_version": 1,
  "_score": 1,
  "_source": {
    "uuid": "4468b79e-e391-5d48-b533-2d480142a289",
    "user": "ripsaw",
    "host": "10.130.5.8",
    "cluster_name": "myk8scluster",
    "job_number": 1,
    "fio-version": "fio-3.27",
    "job_options": {
      "rw": "randread",
      "time_based": "1",
      "runtime": "20",
      "ramp_time": "5"
    },
    "job_name": "randread",
    "log_file": "/tmp/fiod-4468b79e-e391-5d48-b533-2d480142a289/fiojob-randread-64KiB-1/3/randread/fio_lat.1.log.10.130.5.8",
    "sample": 3,
    "log_name": "lat",
    "timestamp": 1656430634000,
    "date": "2022-06-28T15:37:14.000000Z",
    "latency": 1035334,
    "data_direction": "read",
    "block_size": 0,
    "offset": 0,
    "global_options": {
      "directory": "/mnt/pvc",
      "filename_format": "f.\\$jobnum.\\$filenum",
      "write_bw_log": "fio",
      "write_iops_log": "fio",
      "write_lat_log": "fio",
      "log_avg_msec": "3000",
      "clocksource": "clock_gettime",
      "kb_base": "1000",
      "unit_base": "8",
      "ioengine": "libaio",
      "size": "1GiB",
      "bs": "64KiB",
      "iodepth": "4",
      "direct": "1",
      "numjobs": "1"
    },
    "run_id": "NA"
  },
  "fields": {
    "cluster_name.keyword": [
      "myk8scluster"
    ],
    "date": [
      "2022-06-28T15:37:14.000Z"
    ],
    "job_options.runtime.keyword": [
      "20"
    ],
    "global_options.write_bw_log.keyword": [
      "fio"
    ],
    "job_options.rw.keyword": [
      "randread"
    ],
    "global_options.iodepth.keyword": [
      "4"
    ],
    "job_options.time_based.keyword": [
      "1"
    ],
    "global_options.write_iops_log": [
      "fio"
    ],
    "uuid": [
      "4468b79e-e391-5d48-b533-2d480142a289"
    ],
    "user.keyword": [
      "ripsaw"
    ],
    "global_options.size": [
      "1GiB"
    ],
    "log_name.keyword": [
      "lat"
    ],
    "global_options.numjobs": [
      "1"
    ],
    "global_options.unit_base.keyword": [
      "8"
    ],
    "log_file.keyword": [
      "/tmp/fiod-4468b79e-e391-5d48-b533-2d480142a289/fiojob-randread-64KiB-1/3/randread/fio_lat.1.log.10.130.5.8"
    ],
    "log_file": [
      "/tmp/fiod-4468b79e-e391-5d48-b533-2d480142a289/fiojob-randread-64KiB-1/3/randread/fio_lat.1.log.10.130.5.8"
    ],
    "host": [
      "10.130.5.8"
    ],
    "job_number": [
      1
    ],
    "host.keyword": [
      "10.130.5.8"
    ],
    "global_options.directory.keyword": [
      "/mnt/pvc"
    ],
    "offset": [
      0
    ],
    "log_name": [
      "lat"
    ],
    "job_options.rw": [
      "randread"
    ],
    "global_options.log_avg_msec": [
      "3000"
    ],
    "global_options.write_lat_log": [
      "fio"
    ],
    "global_options.clocksource.keyword": [
      "clock_gettime"
    ],
    "global_options.numjobs.keyword": [
      "1"
    ],
    "global_options.log_avg_msec.keyword": [
      "3000"
    ],
    "global_options.kb_base": [
      "1000"
    ],
    "global_options.bs.keyword": [
      "64KiB"
    ],
    "global_options.direct.keyword": [
      "1"
    ],
    "job_options.ramp_time": [
      "5"
    ],
    "job_options.runtime": [
      "20"
    ],
    "global_options.filename_format.keyword": [
      "f.\\$jobnum.\\$filenum"
    ],
    "global_options.write_iops_log.keyword": [
      "fio"
    ],
    "latency": [
      1035334
    ],
    "uuid.keyword": [
      "4468b79e-e391-5d48-b533-2d480142a289"
    ],
    "global_options.clocksource": [
      "clock_gettime"
    ],
    "global_options.filename_format": [
      "f.\\$jobnum.\\$filenum"
    ],
    "run_id.keyword": [
      "NA"
    ],
    "fio-version.keyword": [
      "fio-3.27"
    ],
    "global_options.direct": [
      "1"
    ],
    "global_options.iodepth": [
      "4"
    ],
    "block_size": [
      0
    ],
    "timestamp": [
      1656430634000
    ],
    "cluster_name": [
      "myk8scluster"
    ],
    "fio-version": [
      "fio-3.27"
    ],
    "run_id": [
      "NA"
    ],
    "data_direction": [
      "read"
    ],
    "data_direction.keyword": [
      "read"
    ],
    "global_options.ioengine.keyword": [
      "libaio"
    ],
    "job_options.ramp_time.keyword": [
      "5"
    ],
    "sample": [
      3
    ],
    "global_options.size.keyword": [
      "1GiB"
    ],
    "global_options.unit_base": [
      "8"
    ],
    "global_options.write_bw_log": [
      "fio"
    ],
    "job_options.time_based": [
      "1"
    ],
    "global_options.kb_base.keyword": [
      "1000"
    ],
    "global_options.bs": [
      "64KiB"
    ],
    "global_options.ioengine": [
      "libaio"
    ],
    "job_name": [
      "randread"
    ],
    "job_name.keyword": [
      "randread"
    ],
    "global_options.write_lat_log.keyword": [
      "fio"
    ],
    "global_options.directory": [
      "/mnt/pvc"
    ],
    "user": [
      "ripsaw"
    ]
  }
}
It leads me to the index template, is possible that my template is wrong?
{
    "index_patterns" : "ripsaw-fio-log*",
    "priority" : 0,
    "template": {
      "mappings": {
          "properties": {
              "time_ms": { "type": "date" }
          }
      }
    }
}
I created the index template as the same as yours here in the kibana console and setting the data source succeeds, but the data hasn't shown yet.
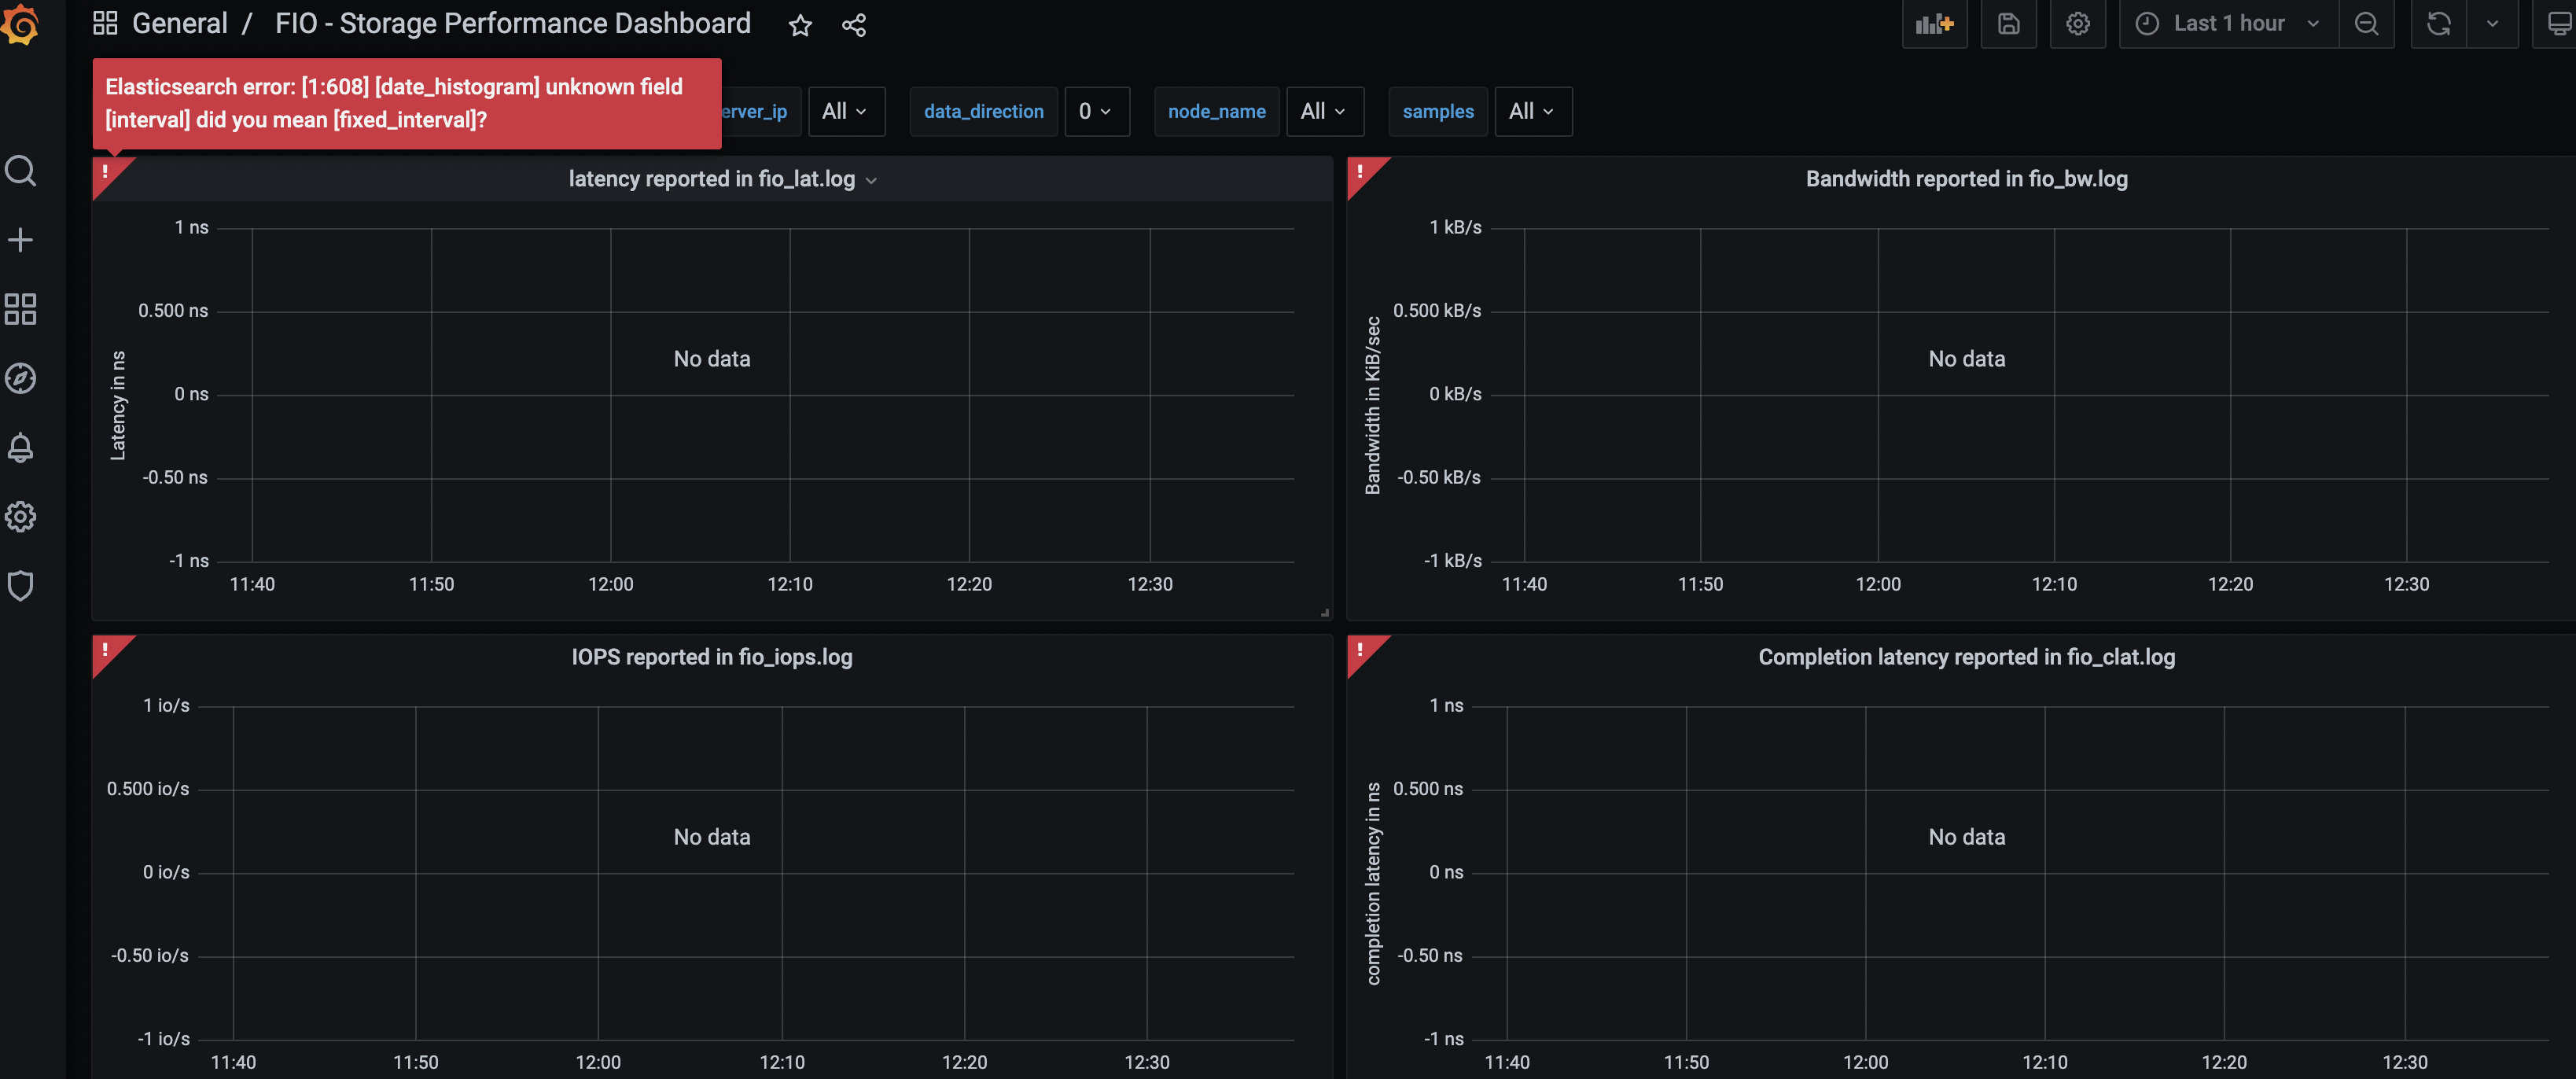
With the error message in the grafana console, I thought interval should be changed to fix_interval since I used ES 8.3 but it didnt' help me out either. https://github.com/grafana/grafana/issues/19911
Not sure this is a benchmark-operator issue? Seems to be more about how the results are indexed or visualized.
Issue is missing filed time_ms which is not present in the index. That is reason why Grafana can not print data. Question is why date in time_ms are not filled.
Is this still relevant? If so, what is blocking it? Is there anything you can do to help move it forward?
This issue has been automatically marked as stale because it has not had recent activity. It will be closed if no further activity occurs.
Is this still relevant? If so, what is blocking it? Is there anything you can do to help move it forward?
This issue has been automatically marked as stale because it has not had recent activity. It will be closed if no further activity occurs.