visclaw
 visclaw copied to clipboard
Patch Grid Cell Edge Drawing Masking Not Working
In the Chile GeoClaw example the amr_celledges_show = [0,0,0] for the water is not being respected. It looks like the amr_celledges_show = [1,1,0] from the land plot item is being used instead. These are being plotted in the same figure so perhaps something is overriding the first celledges_show parameter?
I may have broken that with 50d320b2cd289c1f876ff640a36e37ba7bfeb1df, though I can't see exactly how. Can you test whether it is okay at the previous commit (e54afa6db0d36426159d9c6ad4228b181caa33c7) or tell me how to test it?
The example that does not work is in $GEOCLAW/examples/tsunami/chile2010 with my example-fixes branch. I stared at the code for a bit and did not figure out what was wrong. I will try testing at the previous commit.
The issue was not what I originally thought. The GeoClaw plotting uses separate plot items for the land and water areas. In this particular plot the land has the first two levels cell edges showing where the water has none. It appears that the land plot item is plotting it's cell edges even where it is masked. I am working on a simple matplotlib example to see if this occurs at that level or something has changed in the patch looping (I am guessing a matplotlib problem but we will see).
Matplotlib does not seem to be at fault. If you try out this example
import numpy as np
import matplotlib.pyplot as plt

x = np.linspace(0,1,10)
y = np.linspace(0,1,10)
[X,Y] = np.meshgrid(x,y)

Z = np.ma.masked_where(X < 0.5, X*Y)

plt.pcolor(X,Y,Z)
plt.pcolor(X,Y,Z,edgecolors='k')
plt.show()
the grid edges are plotted properly. What we need can be seen in 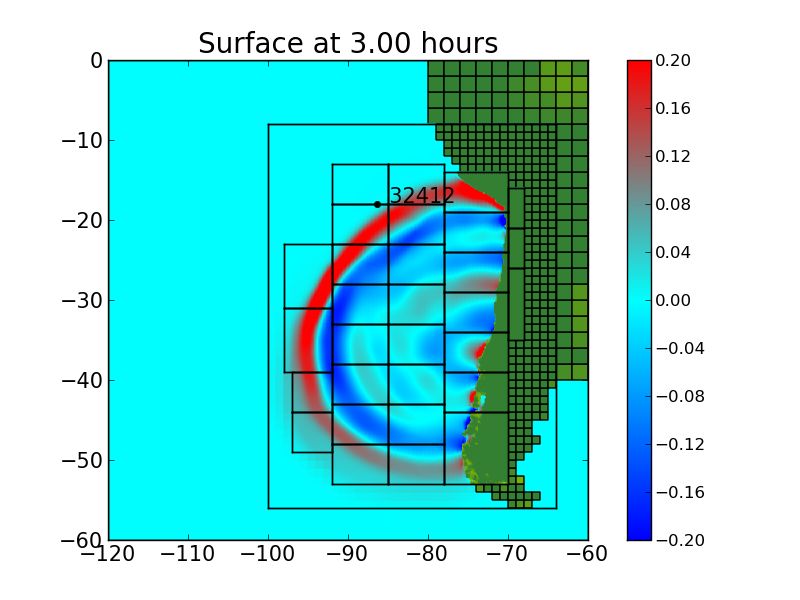 as opposed to
  .
.
Somehow the grid edges are being plotted everywhere instead of only the array masked region.