Depiction of complicated clonal structure
Greetings,
I would like to depict the clonal structure of a patient that acquired a mutation following therapy. The VAF of the new mutation is 45%. I have 3 time points and the clonal structure looks like this: c(42,42,23,20,0, 1.6,0.01,0.01,0,0, 45,45,23,0,45) I can only plot the new mutation as parent (see my code below). And I was wondering if there is any way I could plot it as clone 4. A clone that contains the 3 mutations that were present in baseline and the new mutation acquired following therapy.
Many thanks for your help! It is much appreciated!
Code: timepoints=c(0,75,150) frac.table = matrix( c(42,42,23,20,0, 1.6,0.01,0.01,0,0.01, 45,45,23,0,45), ncol=length(timepoints))
parents = c(0,1,2,3,0) fish = createFishObject(frac.table,parents,timepoints=timepoints) fish = layoutClones(fish)
fishPlot(fish,shape="spline",title.btm="148",
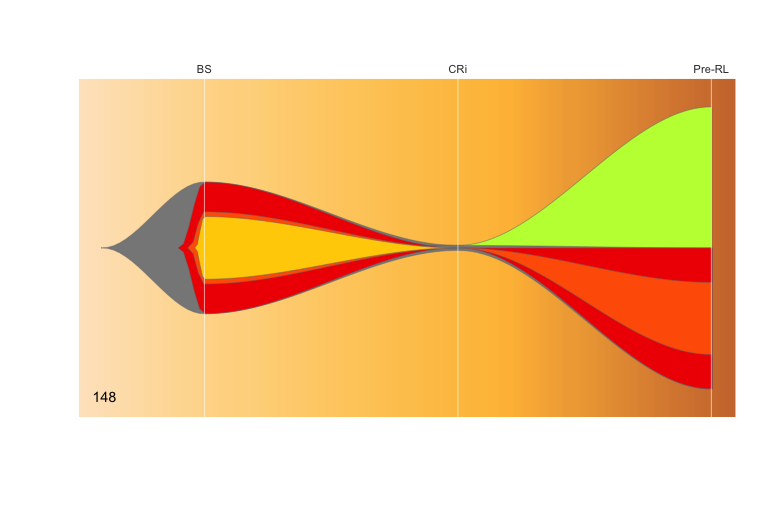
     cex.title=0.9, vlines=c(0,75,150),
     vlab=c("BS","CRi","Pre-RL"))