RNN-Time-series-Anomaly-Detection
 RNN-Time-series-Anomaly-Detection copied to clipboard
Is it unsupervised learning? Why is the label needed?
I can't understand why the label is needed.
I think the train data does not contain anomalies and the test data contains anomalies. So, I process my data as follow, the train data is the normal historical data while the test data contains man-made anomalies, but the result is disappointing. What can I do?

Is it unsupervised learning? Yes. The network in this repo is trained as a non-supervised learning method. Labels are not used when training.
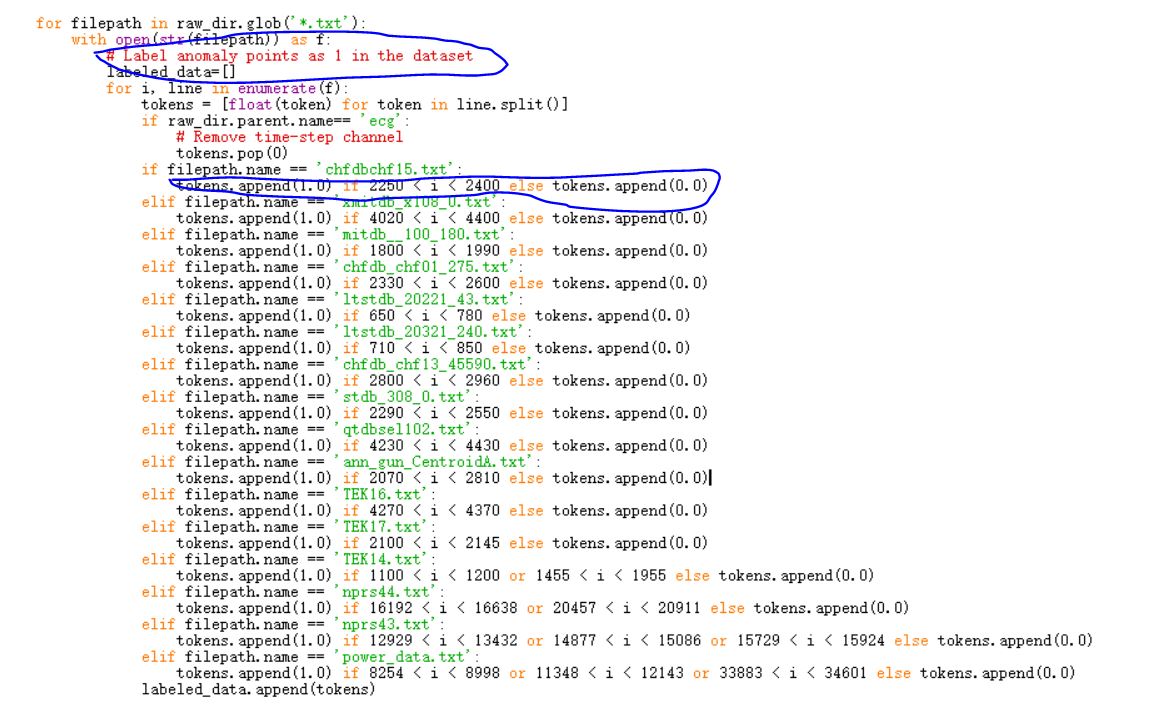
Why is the label needed? Labels are needed to evaluate model performance. If there is no label, how can we evaluate the accuracy of the model?
I think the train data does not contain anomalies and the test data contains anomalies. So, I process my data as follow, the train data is the normal historical data while the test data contains man-made anomalies, but the result is disappointing. What can I do? What does your data look like? Is the data periodic? I think the method seems hard to detect anomalies of aperiodic data.
 As the picture above, the data is periodic. I do not know which data should be labeled 1 and which data should be labeled 0 as my train data has no anomaly while the test data contains anomalies, and they are collected respectively in different situation as follow:
 @chickenbestlover
Wow, your data looks really cool! I never tried 16-dimensional data simply because I don't have one. I cannot find any anomalous points in your data. Is this figure test dataset which contains anomalous points? If so, where are anomalous points? And from which sensor did you get the last anomaly scores?
Can it be real-time monitoring?