ProLIF
 ProLIF copied to clipboard
adjusting the Ligand Interaction Network plot
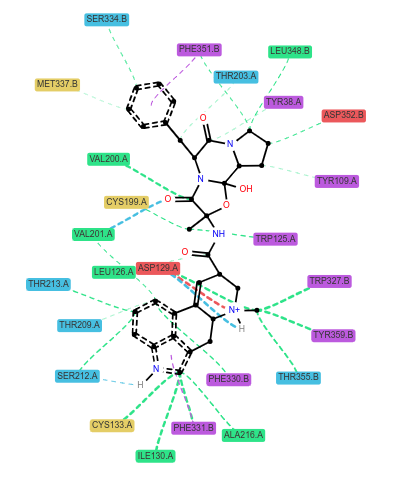
good morning, I am testing the Ligand Interaction Network library with the example provided in the documents (section 4.2. Ligand Interaction Network (LigPlot). I observe that the chemical representation of the ligand is a little bit distorted, with bonds between sp3 carbon being represented in random angles. I am using the following line of code to generate the plot:
net = LigNetwork.from_ifp(df, lmol, kind="aggregate", threshold=.3, rotation=270, match3D=False)
in this case 'lmol' is generated using:
lig = u.select_atoms("resname LIG") lmol = plf.Molecule.from_mda(lig)
the plot I am obtaining is "1.png"
Is it possible to process 'lmol' with RDKit to get a more refined representation of the ligand? For example, if several ligands bound to the same protein are to be plotted, is it possible to obtain a user defined ligand orientation with the LigNetwork library?
Thank you very much in advance for the support,
kind regards
Alfredo
Hi @alfredoq and sorry for the late response.
If you set match3D=False, it will generate new 2D coordinates for your ligand, a bit as if you generated the structure from a SMILES string.
If you leave it to True (the default), it will try to generate 2D coordinates that somehow resemble the 3D conformer of your ligand, using RDKit's rdkit.Chem.rdDepictor.GenerateDepictionMatching3DStructure function. This is not perfect but is usually much more readable than using directly the 3D conformation. If you're working with an MD trajectory, you should be able to select which frame is used to set the 3D conformation of the ligand with:
u.trajectory[42]  # use frame number 42 in your trajectory
lig = u.select_atoms("resname LIG")
lmol = plf.Molecule.from_mda(lig)
So if you want to use "custom made" coordinates you have to use match3D=True but it will still modify them as it calls GenerateDepictionMatching3DStructure on your lmol.
If your lmol only contains 2D coordinates, I'm not sure what happens, I didn't really think of this scenario initially. If you would need LigNetwork to directly use the coordinates inside lmol without modifications, it should be an easy update of the code on my side so just tell me. You can also try it directly by commenting out lines 200 to 203 in the prolif/plotting/network.py file:
# if match3D:
#     rdDepictor.GenerateDepictionMatching3DStructure(mol, lig_mol)
# else:
#     rdDepictor.Compute2DCoords(mol, clearConfs=True)
PS: if you manually modify the coordinates of your lmol, please make sure that the indices of the atoms in your modified lmol are the same as in the original lmol, otherwise the interactions displayed will make no sense.