Dashboard - Add aggregated view for the set of API/Browser checks
💡 For general support requests and bug reports, please go to checklyhq.com/support
Is your feature request related to a problem? Please describe. Let’s say that I have 5 API checks (all tagged with my_tag). I’d like to show a dashboard with just one status that aggregates all 5 individual checks. e.g. if all 5 checks are green then I’d like to see green status on the dashboard, if one of them is amber then it’s amber at the group level etc.
I simply don’t want to expose details to end-users of how many API checks are performed to show whenever the back-end of my application is alive or not.
Describe the solution you'd like A single traffic light for a group of API or Browser checks
Describe alternatives you've considered Use a different provider ;-)
Additional context
This could be consistent with grouping of checks on the home screen:
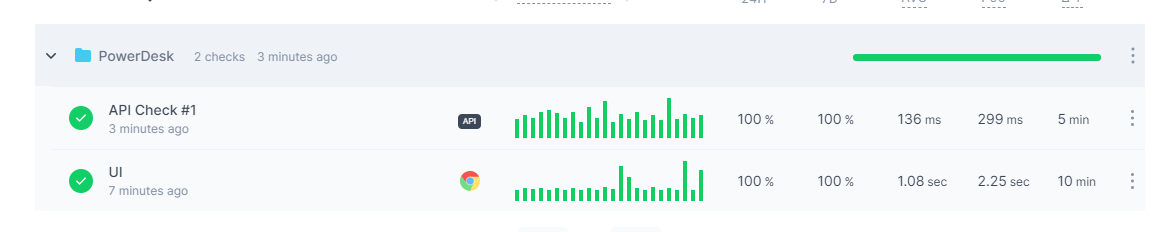
We would like to present a dashboard that has 1 item 'PowerDesk' instead of individual checks
@maulemon sounds like a cool use case. I'm not 100% sure we will support this, but maybe I can ask a question: If we would give you access to all the dashboard data through an API, and maybe an example React/Next/Vue repo, would this be something you would build yourself?
I'm actively exploring how we can make the data we expose through our public API more useful, as we are a small company and cannot build out all variations of all dashboards. But we can give you the tools to do so much easier.