Allow dashed bar borders
I'm trying to make dashed borders for the bar chart, but having trouble with 2.8. I've found code online that has working examples for 2.1: http://jsfiddle.net/Ls8u10dp/ but the same thing doesn't work with 2.8: http://jsfiddle.net/L7ubzshc/
Is there any way around this?
Thanks
@perkalerk border dash is not currently available for BAR chart. Maybe you could ask for an enhancement or prepare a PR.
In version 2.9.2, as far as I have seen, the elements are changed into ES6 objects and therefore the examples does not work anymore. But let me say I'm not really a JS developer and maybe someone else can find another workaround.
But waiting for enhancement, you can use a plugin to do what you need.
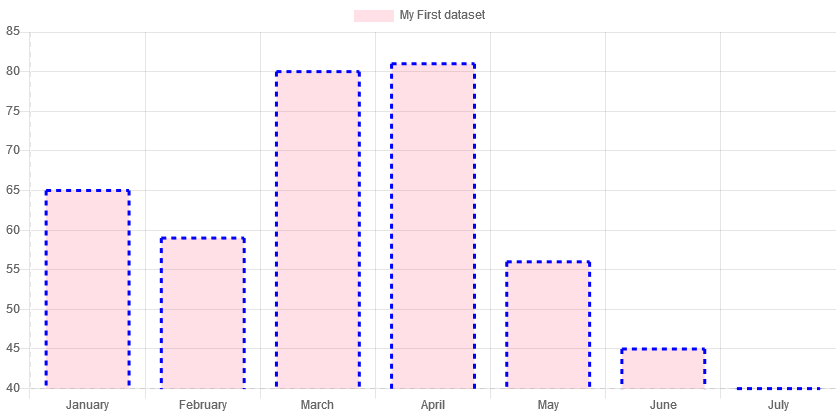
I've prepared an example (you should extend it if you have other requiremets) and it should work (tested in your jsfiddle link). Here you can see the whole Javascript part:
var config = {
  type: 'bar',
  data: {
    labels: ["January", "February", "March", "April", "May", "June", "July"],
    datasets: [{
      label: "My First dataset",
      backgroundColor: "rgba(255,99,132,0.2)",
      data: [65, 59, 80, 81, 56, 45, 40],
      borderColor: 'blue',
      borderWidth: 0,
    }]
  },
  plugins: [{
   afterDatasetDraw: function(chart, args, options) {
      args.meta.data.forEach(function(element) {
        var borderWidth = 3;
        var ctx = chart.ctx;
        var vm = element._view;
        var half = vm.width / 2;
        var left = vm.x - half;
        var right = vm.x + half;
        var top = vm.y;
        var width = right - left;
        var height = chart.chartArea.bottom - top + (borderWidth / 2) - 1;
        ctx.beginPath();
        ctx.lineWidth = borderWidth;
        ctx.strokeStyle = vm.borderColor;
        ctx.setLineDash([5, 5]);
        ctx.moveTo(left, top);
        ctx.lineTo(left, top + height);
        ctx.moveTo(left, top);
        ctx.lineTo(left + width, top);
        ctx.moveTo(left + width, top);
        ctx.lineTo(left + width, top + height);
        ctx.stroke();
        ctx.save();
	});
    }
  }]
};

var ctx = document.getElementById("myChart").getContext("2d");
myChart = new Chart(ctx, config);
A couple of point to pay attention:
- in chart options set
borderWidth: 0,and set your border width by plugin - The legend does not reflect the border width and dash you set. Maybe by legend label callback you can fix it.
Again, just a workaround taht does not address all cases. Apologize if my javascript code is not good!
In version 2.9.2, as far as I have seen, the elements are changed into ES6 objects
That's only in 3.0 (yet to be released)
@perkalerk about why the online code does not work anymore in version 2.8, in this version the Rectangle is drawn without using any line (or stroke) therefore the setLineDash context method does not effect on the the rectangle.
@perkalerk border dash is not currently available for BAR chart. Maybe you could ask for an enhancement or prepare a PR.
In version 2.9.2, as far as I have seen, the elements are changed into ES6 objects and therefore the examples does not work anymore. But let me say I'm not really a JS developer and maybe someone else can find another workaround.
But waiting for enhancement, you can use a plugin to do what you need.
I've prepared an example (you should extend it if you have other requiremets) and it should work (tested in your jsfiddle link). Here you can see the whole Javascript part:
var config = {
  type: 'bar',
  data: {
    labels: ["January", "February", "March", "April", "May", "June", "July"],
    datasets: [{
      label: "My First dataset",
      backgroundColor: "rgba(255,99,132,0.2)",
      data: [65, 59, 80, 81, 56, 45, 40],
      borderColor: 'blue',
      borderWidth: 0,
    }]
  },
  plugins: [{
   afterDatasetDraw: function(chart, args, options) {
      args.meta.data.forEach(function(element) {
        var borderWidth = 3;
        var ctx = chart.ctx;
        var vm = element._view;
        var half = vm.width / 2;
        var left = vm.x - half;
        var right = vm.x + half;
        var top = vm.y;
        var width = right - left;
        var height = chart.chartArea.bottom - top + (borderWidth / 2) - 1;
        ctx.beginPath();
        ctx.lineWidth = borderWidth;
        ctx.strokeStyle = vm.borderColor;
        ctx.setLineDash([5, 5]);
        ctx.moveTo(left, top);
        ctx.lineTo(left, top + height);
        ctx.moveTo(left, top);
        ctx.lineTo(left + width, top);
        ctx.moveTo(left + width, top);
        ctx.lineTo(left + width, top + height);
        ctx.stroke();
        ctx.save();
	});
    }
  }]
};

var ctx = document.getElementById("myChart").getContext("2d");
myChart = new Chart(ctx, config);
A couple of point to pay attention:
- in chart options set
borderWidth: 0,and set your border width by plugin- The legend does not reflect the border width and dash you set. Maybe by legend label callback you can fix it.
Again, just a workaround taht does not address all cases. Apologize if my javascript code is not good!
Hi, Your code Is good and working with latest version for bar chart. do you have code for horizontal bar chart ?
Hi, below code is working for 'Horizontal Bar'.
var config = {
  type: 'horizontalBar',
  scales:{
  xAxes:[{position : 'top', ticks: {beginAtZero: true, min: 10}}],
  yAxes:[{}]
  },
  data: {
    labels: ["January", "February", "March", "April", "May", "June", "July"],
    datasets: [{
      label: "My First dataset",
      backgroundColor: "rgba(255,99,132,0.2)",
      data: [65, 59, 80, 81, 56, 45, 40],
      borderColor: 'blue',
      borderWidth: 0,
    }]
  },
  plugins: [{
   afterDatasetDraw: function(chart, args, options) {
      args.meta.data.forEach(function(element) {
        var borderWidth = 3;
        var ctx = chart.ctx;
        var vm = element._view;

      	var half = vm.height / 2;
        var top = vm.y - half;
        var bottom = vm.y + half;
        var right = vm.x;
        var left = chart.chartArea.left;

        ctx.beginPath();
        ctx.lineWidth = borderWidth;
        ctx.strokeStyle = vm.borderColor;
        ctx.setLineDash([6, 6]);

        ctx.moveTo(left, top);
        ctx.lineTo(right, top);
        ctx.moveTo(right, top);
        ctx.lineTo(right, bottom);
        ctx.moveTo(right, bottom);
        ctx.lineTo(left, bottom);

        ctx.stroke();
        ctx.save();
	});
    }
  }]
};

var ctx = document.getElementById("myChart").getContext("2d");
myChart = new Chart(ctx, config);
Here is some example how it can be done (extension of the BarElement element) Could you implement this?
class BarElement extends Element {
  constructor(cfg) {
    super();
    this.options = undefined;
    this.horizontal = undefined;
    this.base = undefined;
    this.width = undefined;
    this.height = undefined;
    this.inflateAmount = undefined;
    if (cfg) {
      Object.assign(this, cfg);
    }
  }
  draw(ctx) {
      //------------------------------changed for OT---------------------------------------------
    const {inflateAmount, options: {borderColor, backgroundColor, borderDash}} = this;
      //------------------------------end---------------------------------------------
    const {inner, outer} = boundingRects(this);
    const addRectPath = hasRadius(outer.radius) ? addRoundedRectPath : addNormalRectPath;
    ctx.save();
    if (outer.w !== inner.w || outer.h !== inner.h) {
      ctx.beginPath();
      addRectPath(ctx, inflateRect(outer, inflateAmount, inner));
      ctx.clip();
      addRectPath(ctx, inflateRect(inner, -inflateAmount, outer));
      ctx.fillStyle = borderColor;
      ctx.fill('evenodd');
    }
    ctx.beginPath();
    addRectPath(ctx, inflateRect(inner, inflateAmount));
    ctx.fillStyle = backgroundColor;
    ctx.fill();
      //------------------------------changed for OT---------------------------------------------
    if (borderDash && borderDash.length > 0) {
        ctx.setLineDash(borderDash);
        ctx.strokeStyle = borderColor;
        ctx.stroke();
    }
      //------------------------------end---------------------------------------------
    ctx.restore();
  }
  inRange(mouseX, mouseY, useFinalPosition) {
    return inRange(this, mouseX, mouseY, useFinalPosition);
  }
  inXRange(mouseX, useFinalPosition) {
    return inRange(this, mouseX, null, useFinalPosition);
  }
  inYRange(mouseY, useFinalPosition) {
    return inRange(this, null, mouseY, useFinalPosition);
  }
  getCenterPoint(useFinalPosition) {
    const {x, y, base, horizontal} = this.getProps(['x', 'y', 'base', 'horizontal'], useFinalPosition);
    return {
      x: horizontal ? (x + base) / 2 : x,
      y: horizontal ? y : (y + base) / 2
    };
  }
  getRange(axis) {
    return axis === 'x' ? this.width / 2 : this.height / 2;
  }
}
BarElement.id = 'bar';
BarElement.defaults = {
  borderSkipped: 'start',
  borderWidth: 0,
  borderRadius: 0,
    //------------------------------changed for OT---------------------------------------------
    borderDash: [],
    //------------------------------end---------------------------------------------
  inflateAmount: 'auto',
  pointStyle: undefined
};
BarElement.defaultRoutes = {
  backgroundColor: 'backgroundColor',
  borderColor: 'borderColor'
};
    //------------------------------changed for OT---------------------------------------------
    BarElement.descriptors = {
        _indexable: (name) => name !== 'borderDash'
    }
    //------------------------------end---------------------------------------------
Has someone made a plugin for a single bar to have dotted lines and not all of them?
@sebiglesias you could possibly target a specific bar using the element._index property or any of the other properties in that element.
I'm currently using element._datasetIndex and element._view.backgroundColor to target the bars I want bordered.
Something like this
var config = {
  type: 'bar',
  data: {
    labels: ["January", "February", "March", "April", "May", "June", "July"],
    datasets: [{
      label: "My First dataset",
      backgroundColor: "rgba(255,99,132,0.2)",
      data: [65, 59, 80, 81, 56, 45, 40],
      borderColor: 'blue',
      borderWidth: 0,
    }]
  },
  plugins: [{
   afterDatasetDraw: function(chart, args, options) {
      args.meta.data.forEach(function(element) {
        var borderWidth = 3;
        var ctx = chart.ctx;
        var vm = element._view;
        var half = vm.width / 2;
        var left = vm.x - half;
        var right = vm.x + half;
        var top = vm.y;
        var width = right - left;
        var height = chart.chartArea.bottom - top + (borderWidth / 2) - 1;

       // Prevent beginPath from occurring depending on the index
       if (element._datasetIndex !== 1 && element._index !== 0 && vm.borderColor !== "#000") return;

        ctx.beginPath();
        ctx.lineWidth = borderWidth;
        ctx.strokeStyle = vm.borderColor;
        ctx.setLineDash([5, 5]);
        ctx.moveTo(left, top);
        ctx.lineTo(left, top + height);
        ctx.moveTo(left, top);
        ctx.lineTo(left + width, top);
        ctx.moveTo(left + width, top);
        ctx.lineTo(left + width, top + height);
        ctx.stroke();
        ctx.save();
	});
    }
  }]
};

var ctx = document.getElementById("myChart").getContext("2d");
myChart = new Chart(ctx, config);
Hi, @stockiNail Thank you for the wonderful solution, I have a problem with overlapping, stacked bars are overlapping, can you please check this thread on StackOverflow? thread
@LodiLofa the issue is in the height calculation because it was thought for no-stacked bar.:
var height = chart.chartArea.bottom - top + (borderWidth / 2) - 1;
As you can see, the height is calculated assuming to go to the bottom of chart area. You can try the following, overriding the above row:
const valueTop = element._yScale.getValueForPixel(top);
const value = chart.data.datasets[element._datasetIndex].data[element._index];
const bottom = element._yScale.getPixelForValue(valueTop - value);
var height = bottom - top + (borderWidth / 2) - 1;
codepen: https://codepen.io/stockinail/pen/ExpKEPK
@LodiLofa the issue is in the height calculation because it was thought for no-stacked bar.:
var height = chart.chartArea.bottom - top + (borderWidth / 2) - 1;As you can see, the height is calculated assuming to go to the bottom of chart area. You can try the following, overriding the above row:
const valueTop = element._yScale.getValueForPixel(top);
const value = chart.data.datasets[element._datasetIndex].data[element._index];
const bottom = element._yScale.getPixelForValue(valueTop - value);
var height = bottom - top + (borderWidth / 2) - 1;
codepen: https://codepen.io/stockinail/pen/ExpKEPK
Thank you so much your amazing bro
I had some different requirements:
- Rounded top corners (but only the top bars in a stacked bar chart)
- Loose Typescript
- Inside border
- Supporting scripted border width (depending on which data)
Since I didn't need it / wouldn't test it I removed code for:
- Horizontal bars
- Skipping borders
function getRect(element: any, borderWidth: number) {
  const half = element.width / 2;
  return {
    x: element.x - half + borderWidth / 2,
    y: Math.min(element.y, element.base) + borderWidth / 2,
    width: element.width - borderWidth,
    height: Math.abs(element.base - element.y) - borderWidth,
  };
}

function getRadii(element: any) {
  const { enableBorderRadius, borderSkipped, options } = element;
  const { borderRadius } = options;
  if (!enableBorderRadius) return 0;
  return [
    borderSkipped.top ? 0 : borderRadius,
    borderSkipped.top ? 0 : borderRadius,
    borderSkipped.bottom ? 0 : borderRadius,
    borderSkipped.bottom ? 0 : borderRadius,
  ];
}

export default {
  id: "DashedBorder",
  afterDatasetDraw(chart: any, args: any) {
    const context = chart.getContext();
    const meta = args.meta;
    const dataset = meta.controller.getDataset();
    if (!dataset) return;
    const { dashedBorderDash, dashedBorderWidth } = dataset;
    if (!dashedBorderDash?.length || !dashedBorderWidth) return;
    meta.data.forEach((element: any, dataIndex: number) => {
      const fullContext = {
        ...context,
        dataset,
        dataIndex,
      };
      const borderWidth =
        dashedBorderWidth instanceof Function
          ? dashedBorderWidth(fullContext, element)
          : dashedBorderWidth;
      if (borderWidth === 0) return;

      const ctx = chart.ctx;
      const { x, y, width, height } = getRect(element, borderWidth);
      const radii = getRadii(element);
      ctx.beginPath();
      ctx.lineWidth = borderWidth;
      ctx.strokeStyle = element.options.borderColor;
      ctx.setLineDash(dashedBorderDash);
      ctx.roundRect(x, y, width, height, radii);
      ctx.stroke();
      ctx.save();
    });
  },
};