Line graph a little off
Expected behavior
As the other graphs, when I have a container defined like this
The result is as expected. The graph is in the graph container.
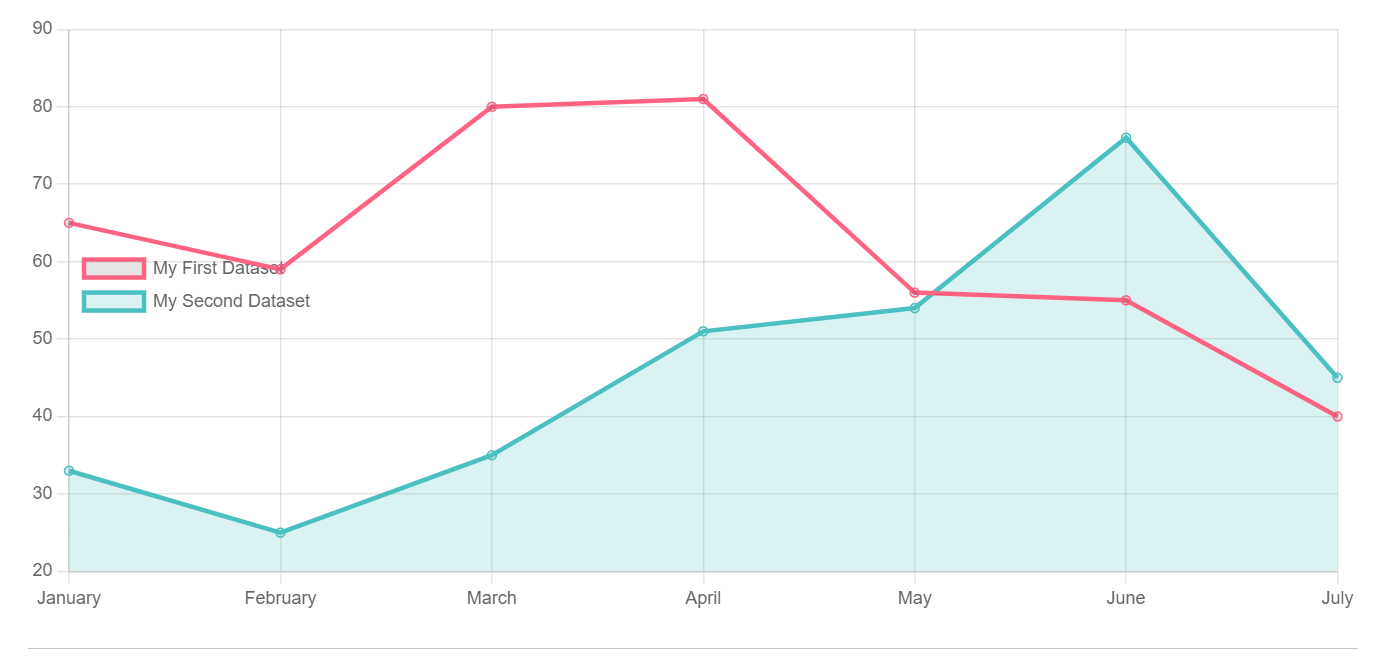
See the horizontal bar at the bottom of the chart.
Current behavior
With the line graph, the graph is a little off with Microsoft Edge
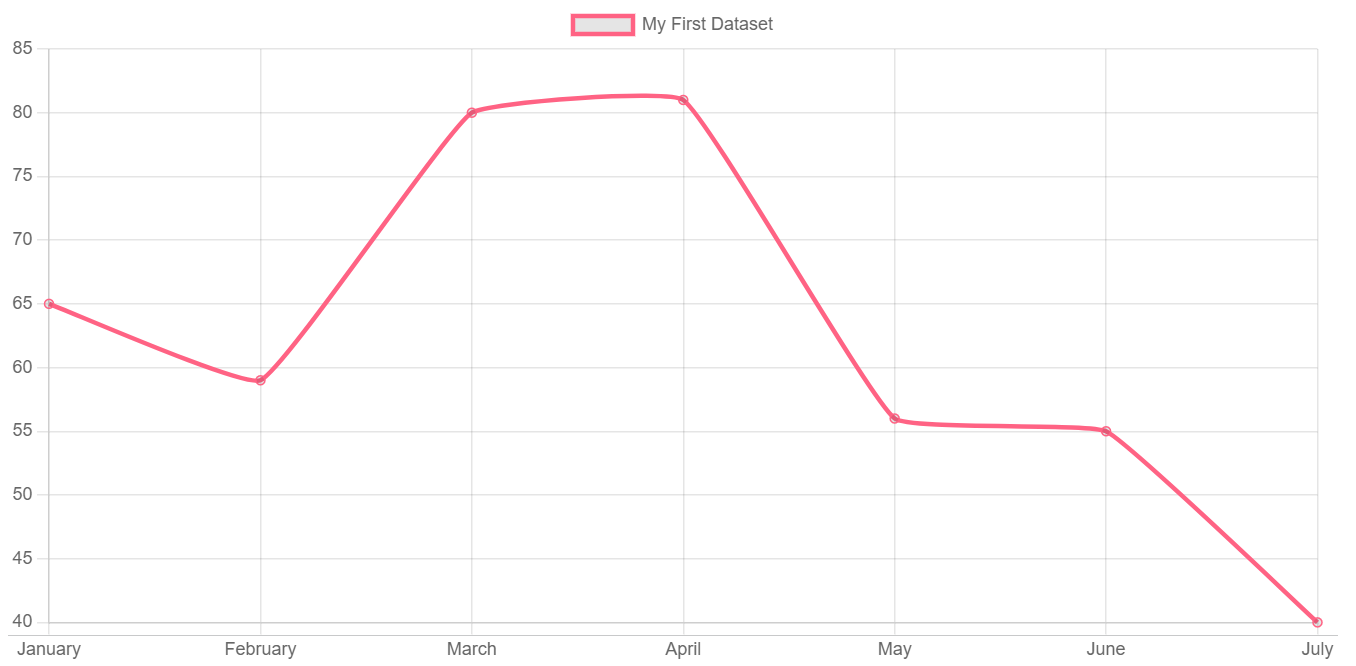
With Firefox is huge
Reproducible sample
https://codepen.io/erossini/pen/jOxRXLN
Optional extra steps/info to reproduce
No response
Possible solution
No response
Context
No response
chart.js version
3.7.1
Browser name and version
Microsoft Edge 106.0.1370.47 (Official build) (64-bit) / Firefox 105.0.3 (64-bit)
Link to your project
https://github.com/erossini/BlazorChartjs
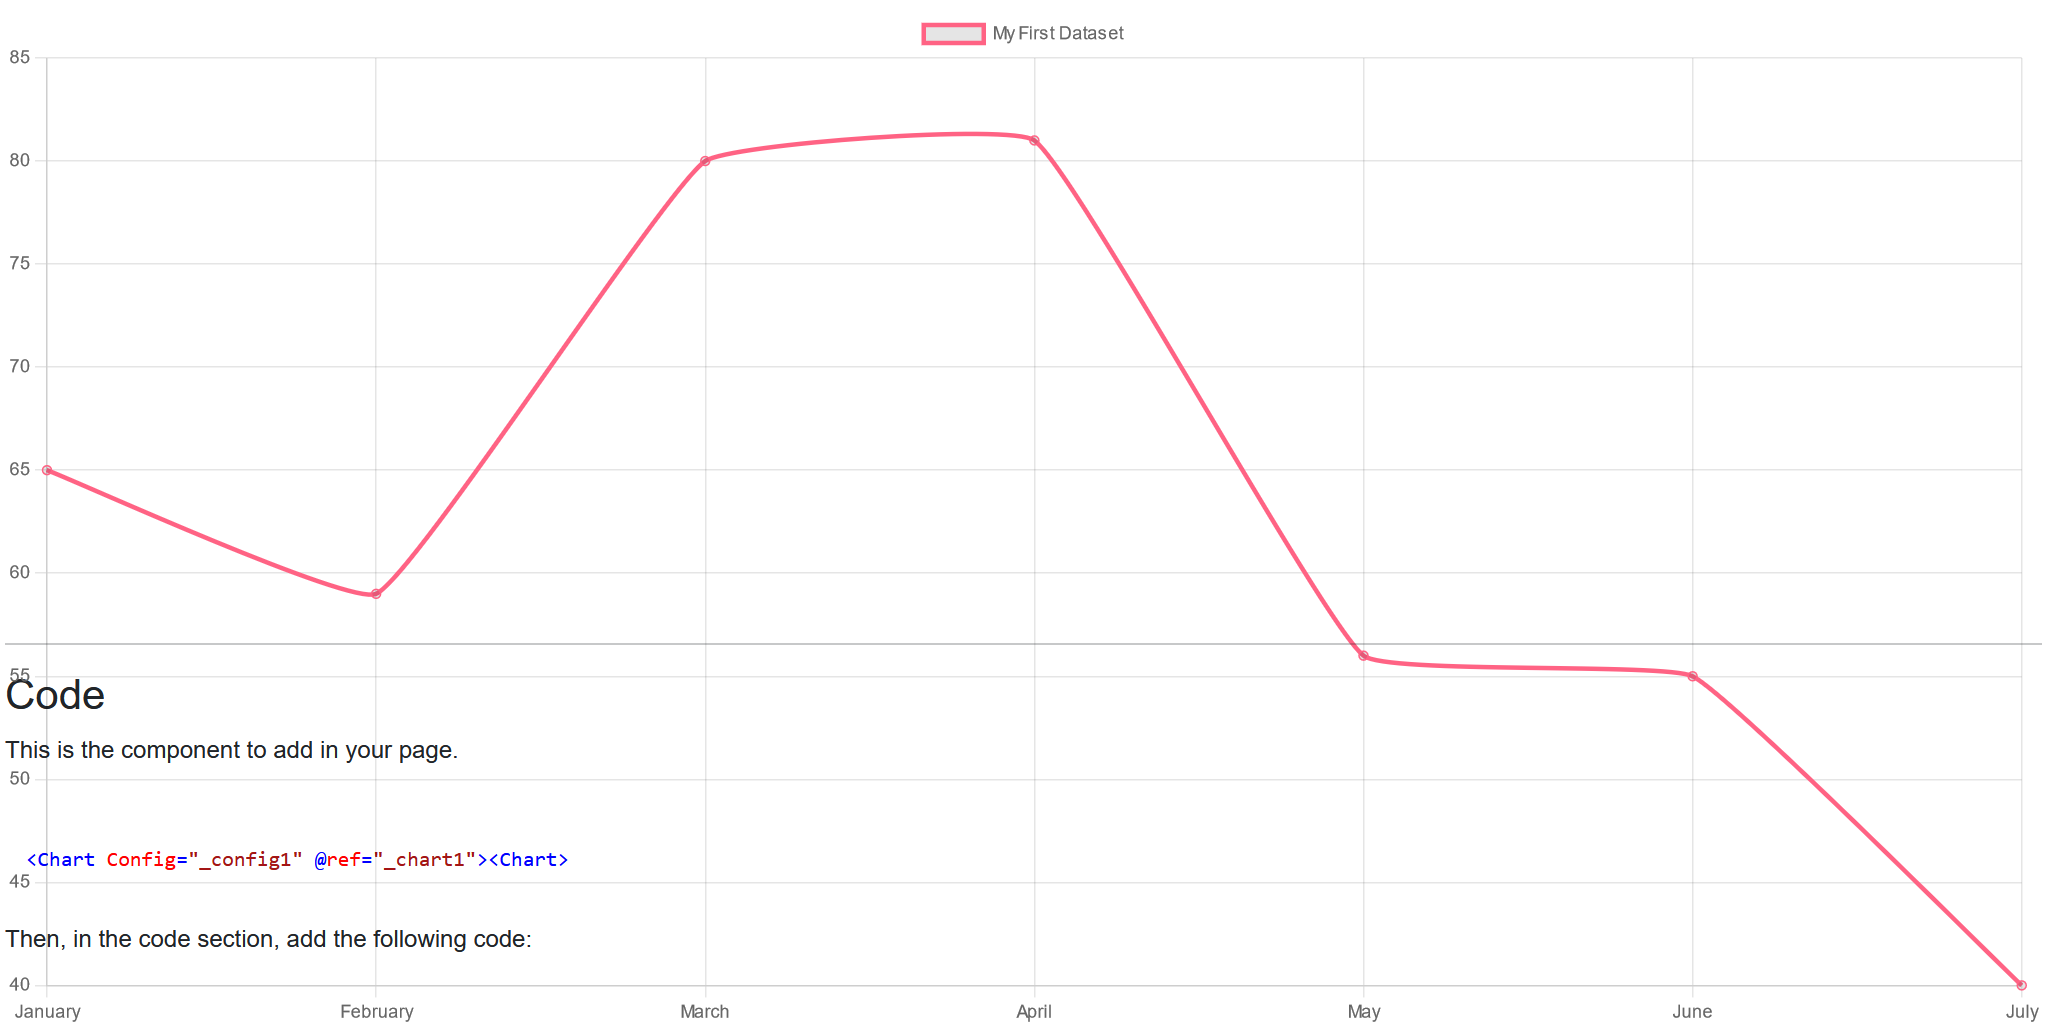
@LeeLenaleee if you insert a p in the div container, it is OK. If you add the p underneath, you have the issue. I updated the codepen
yeah noticed, thats why I deleted comment, didn't see you already gave a reaction 😅