maige
 maige copied to clipboard
Python package to generate math based images
maige
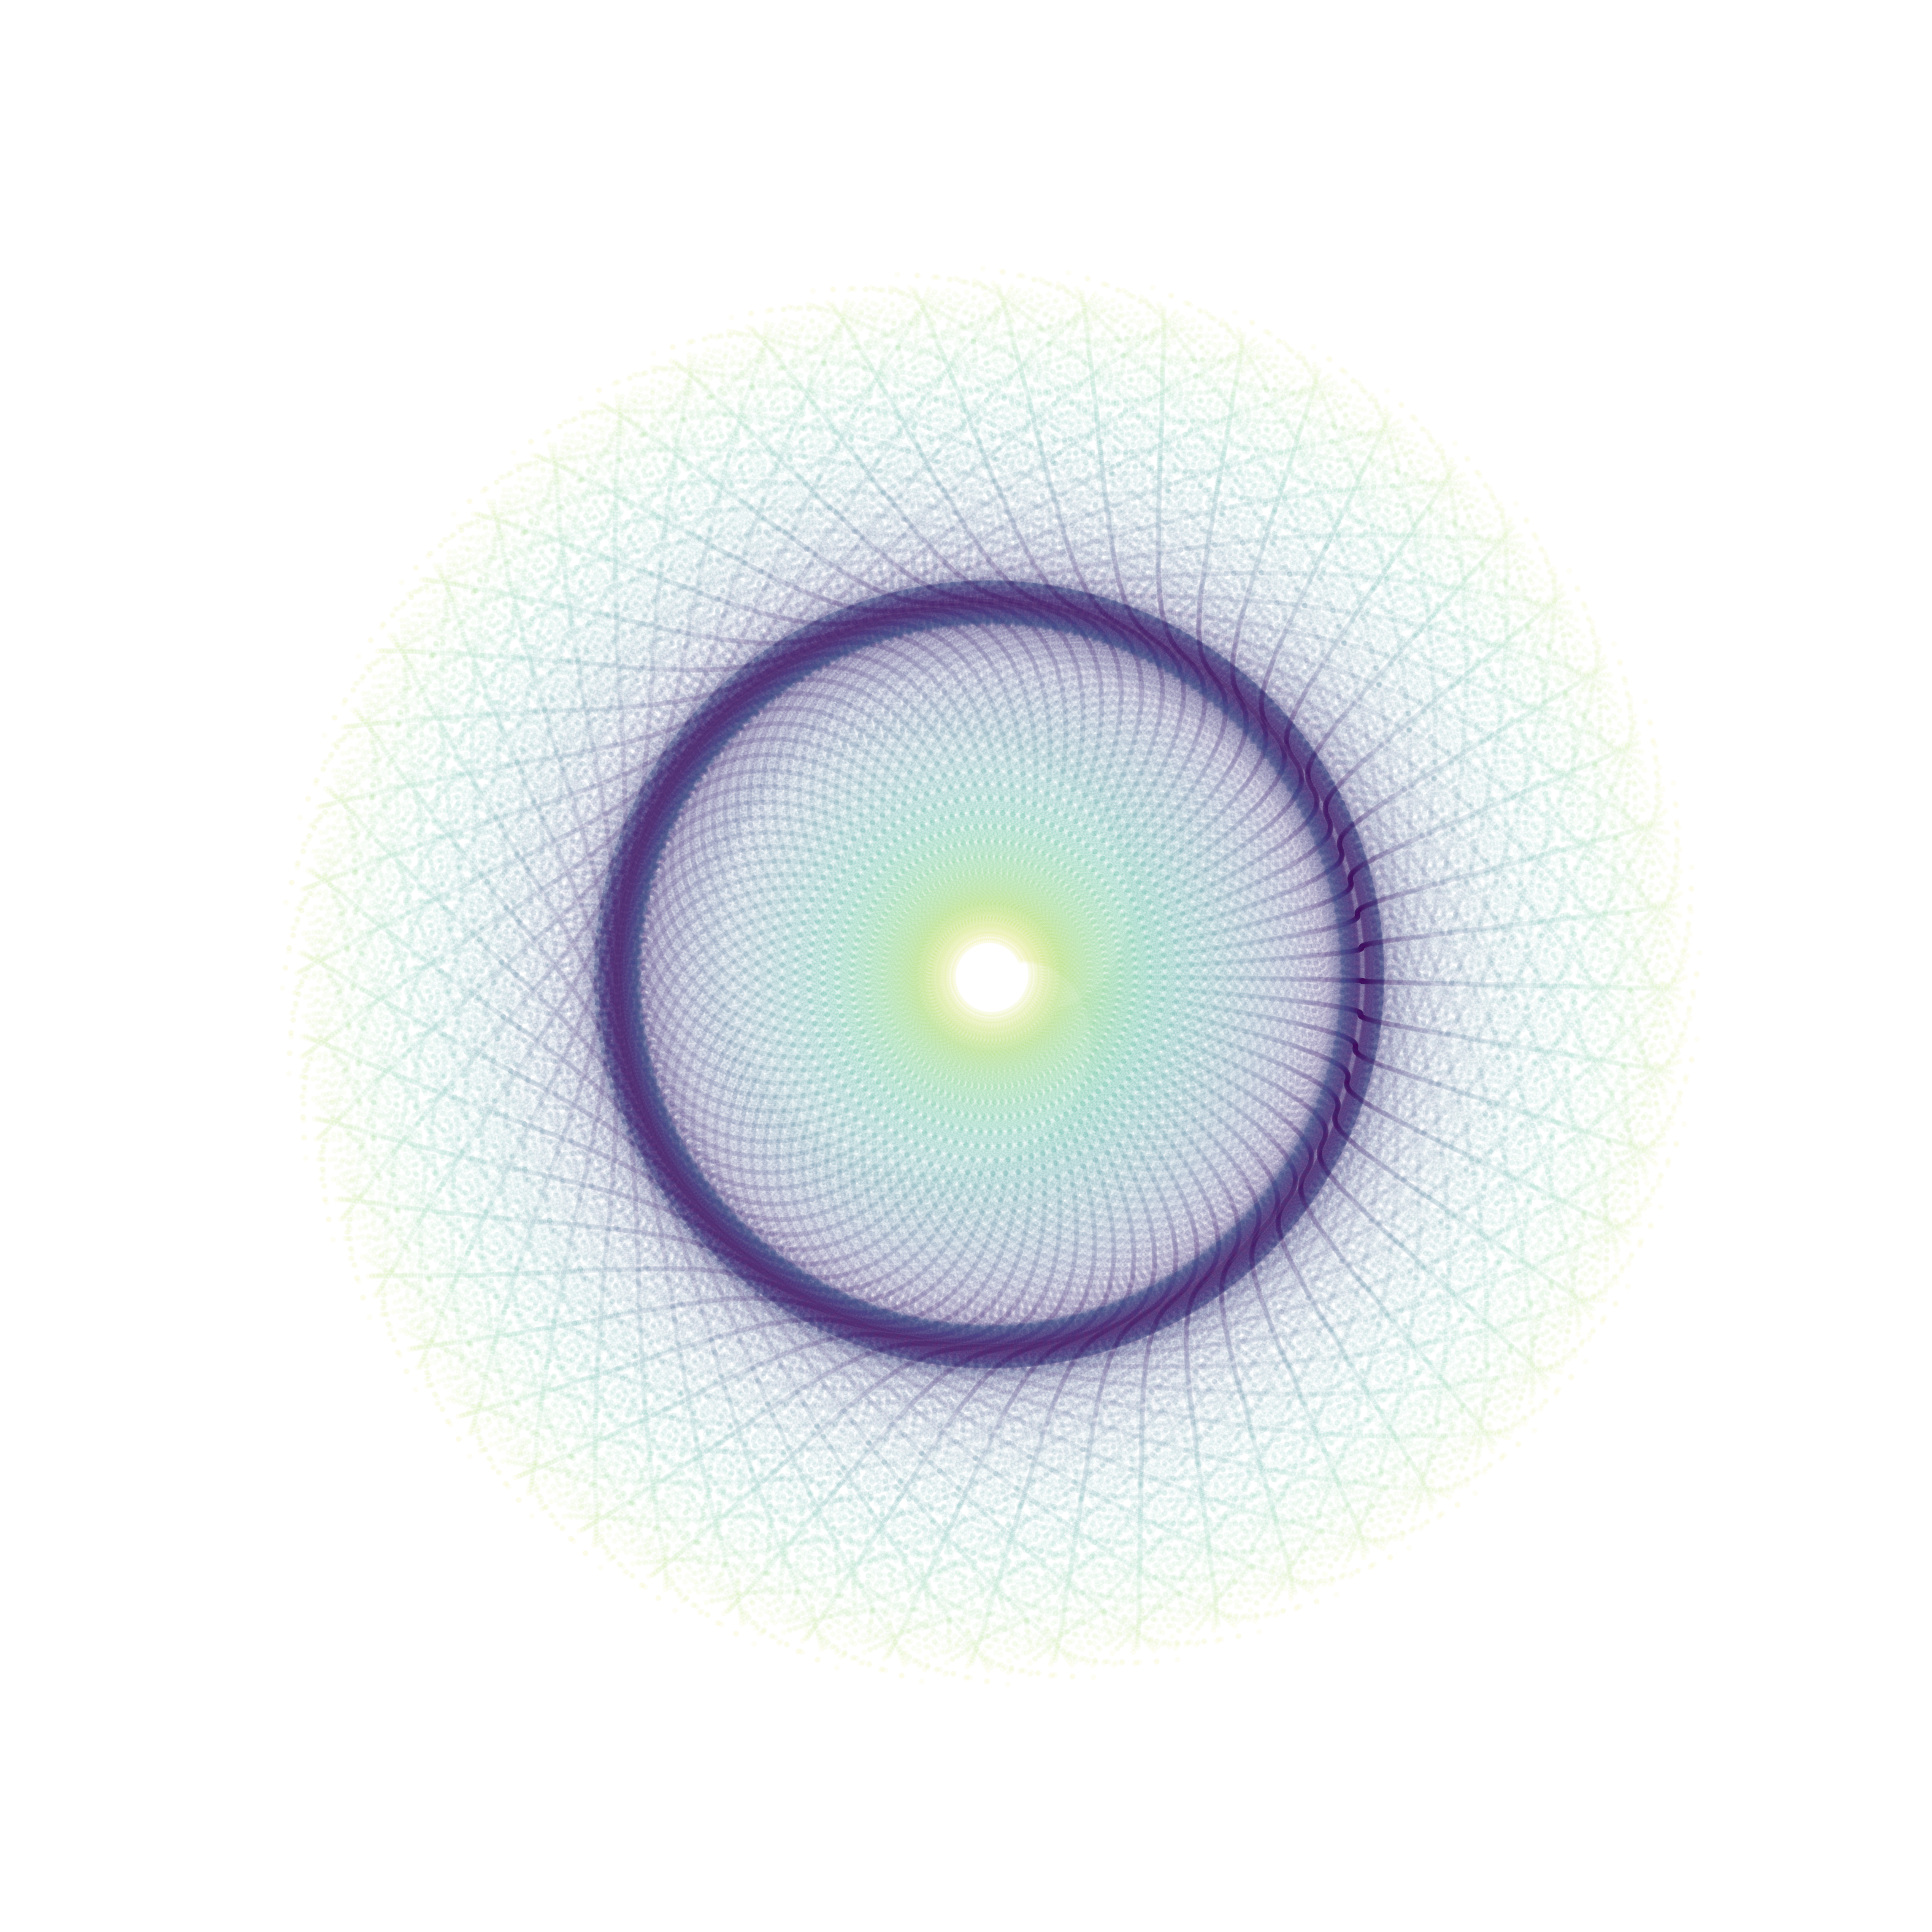
Maige is a package to generate images using mathematical functions, written in pure python. It uses numpy and matplotlib to create images and animations for different formulae. A user can provide their own functions that they would like to plot or use the inbuilt random function generator to generate outputs. A random algebraic function is generated using an Expression Tree that uses various functions provided by numpy. The user can also provide a set of points that they want to plot, instead of using the default set of points. Since the library is built on matplotlib, it can project the output in any projection that is accepted by matplotlib.
Usage
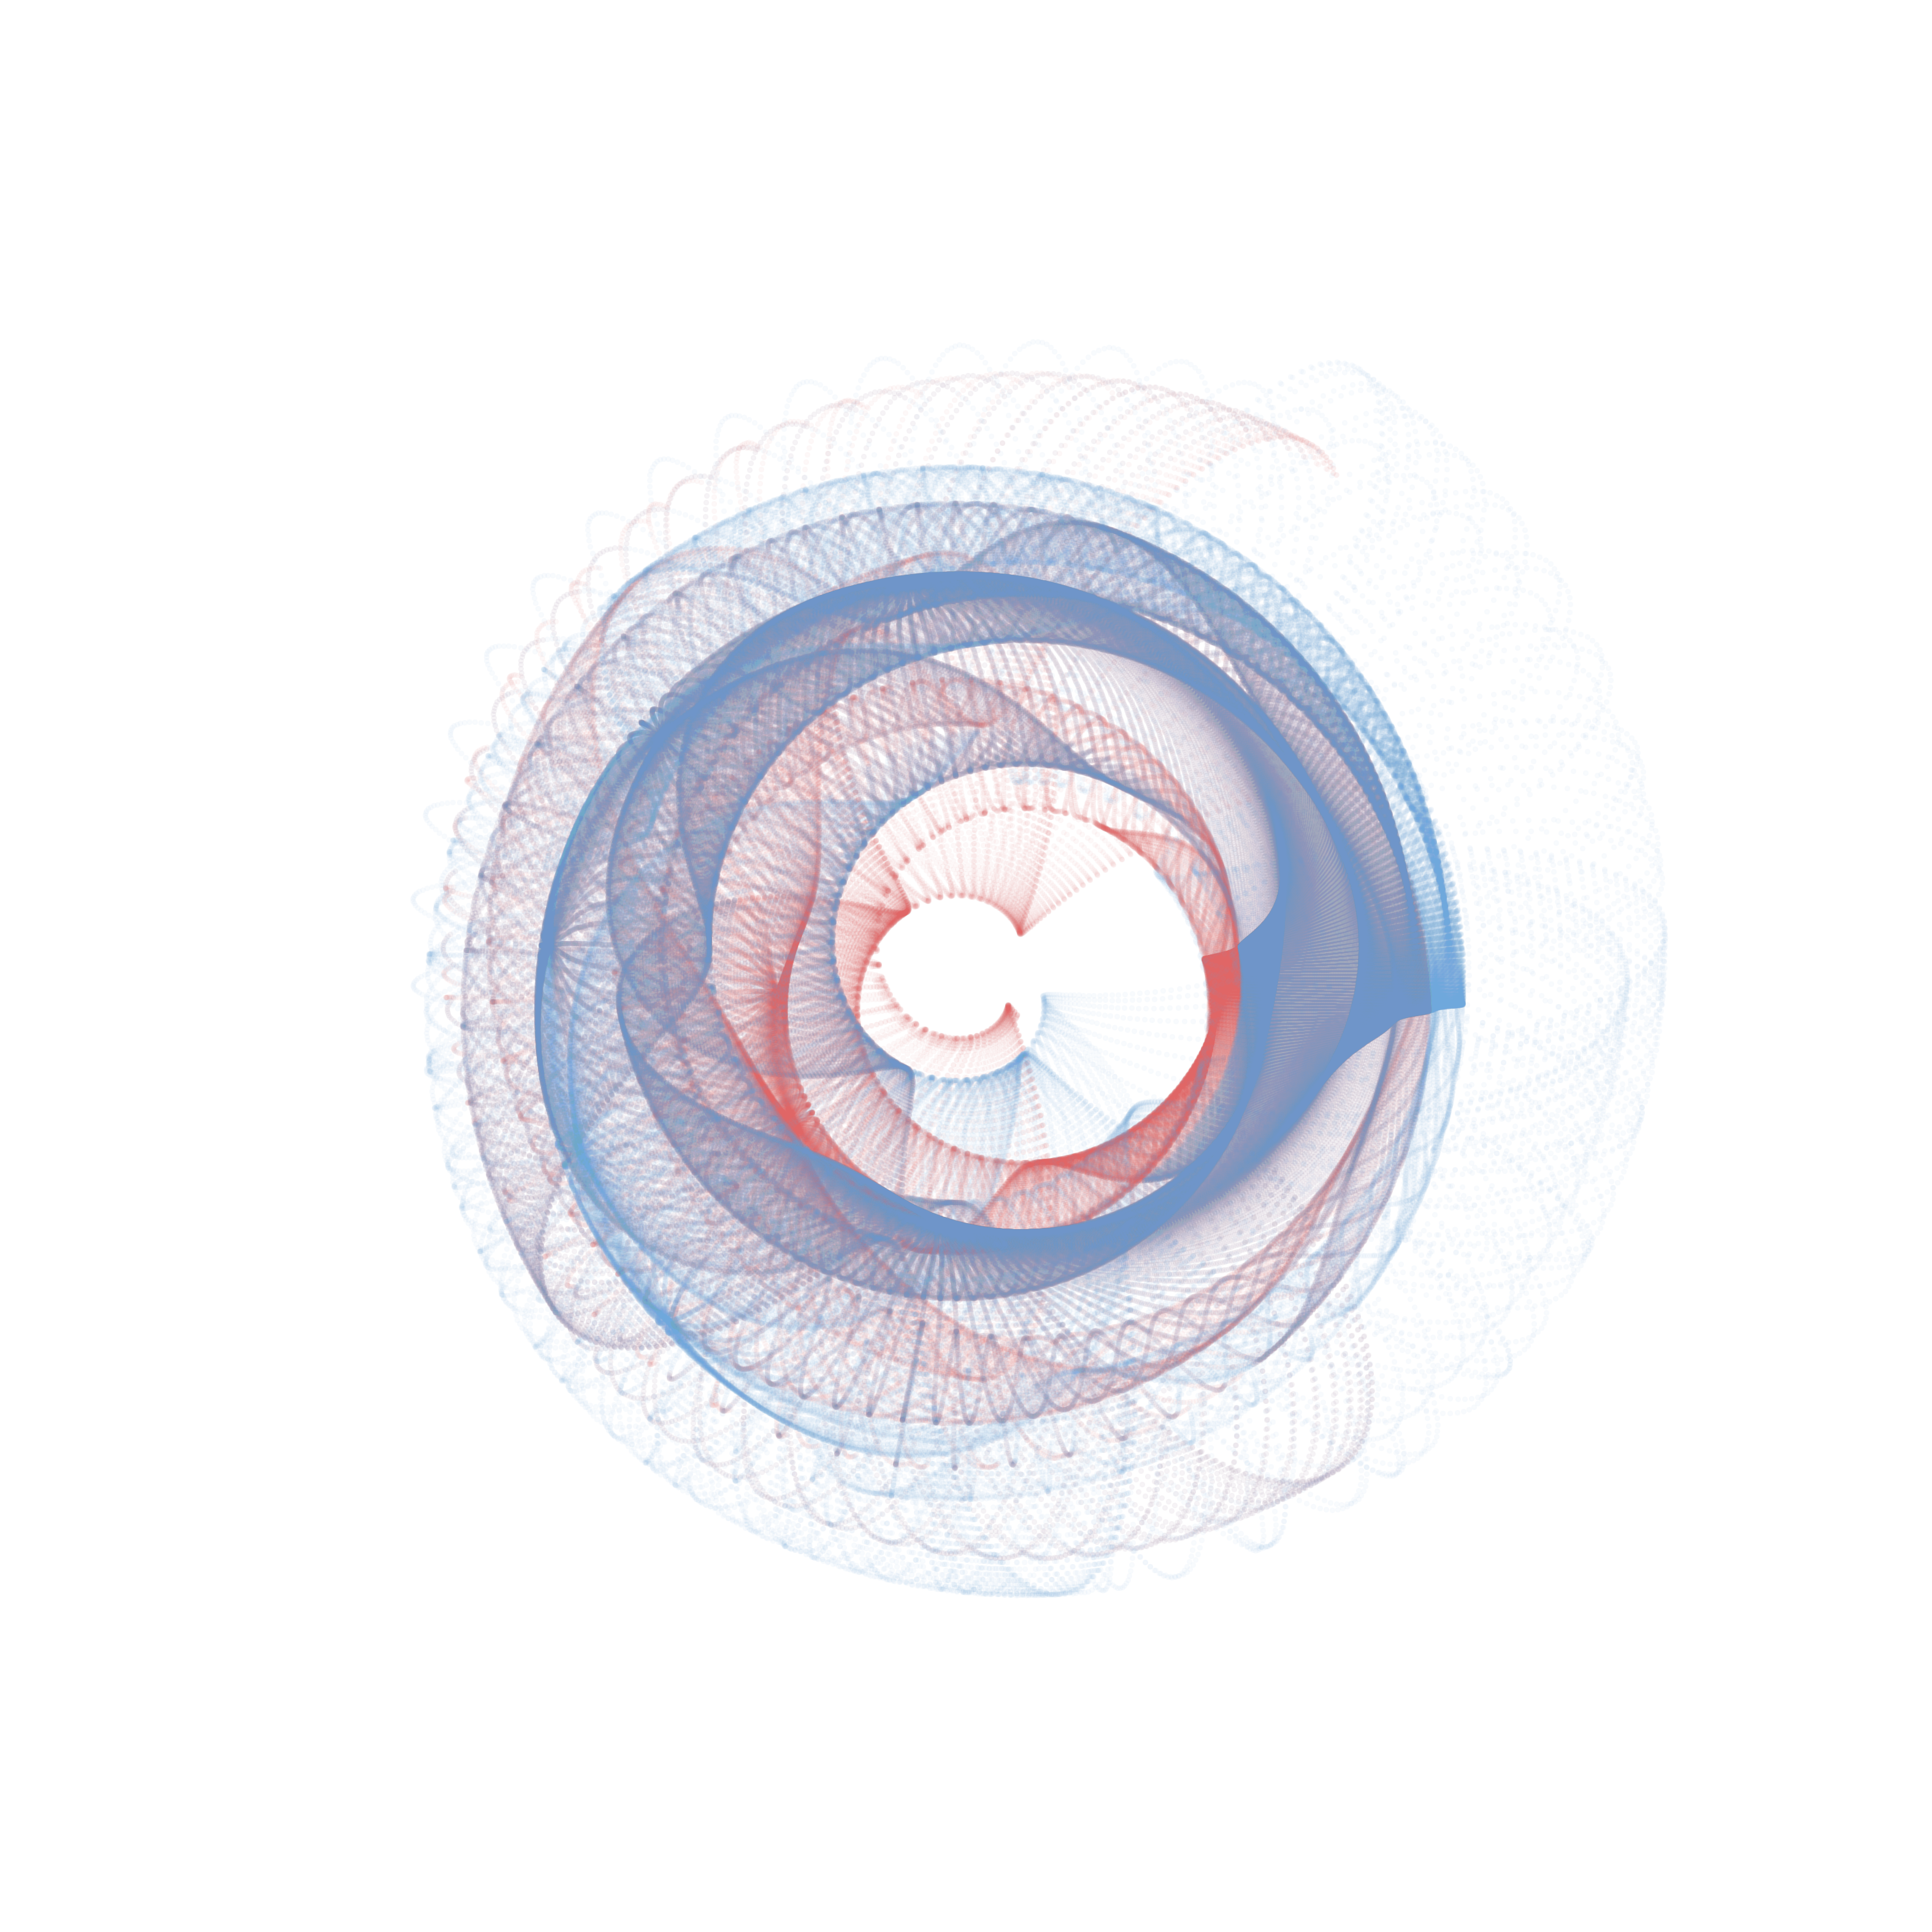
Basic Usage
from maige.generator import Generator
g = Generator()
g.generate_image()

Projection
from maige.generator import Generator
g = Generator(projection="rectilinear")
g.generate_image()

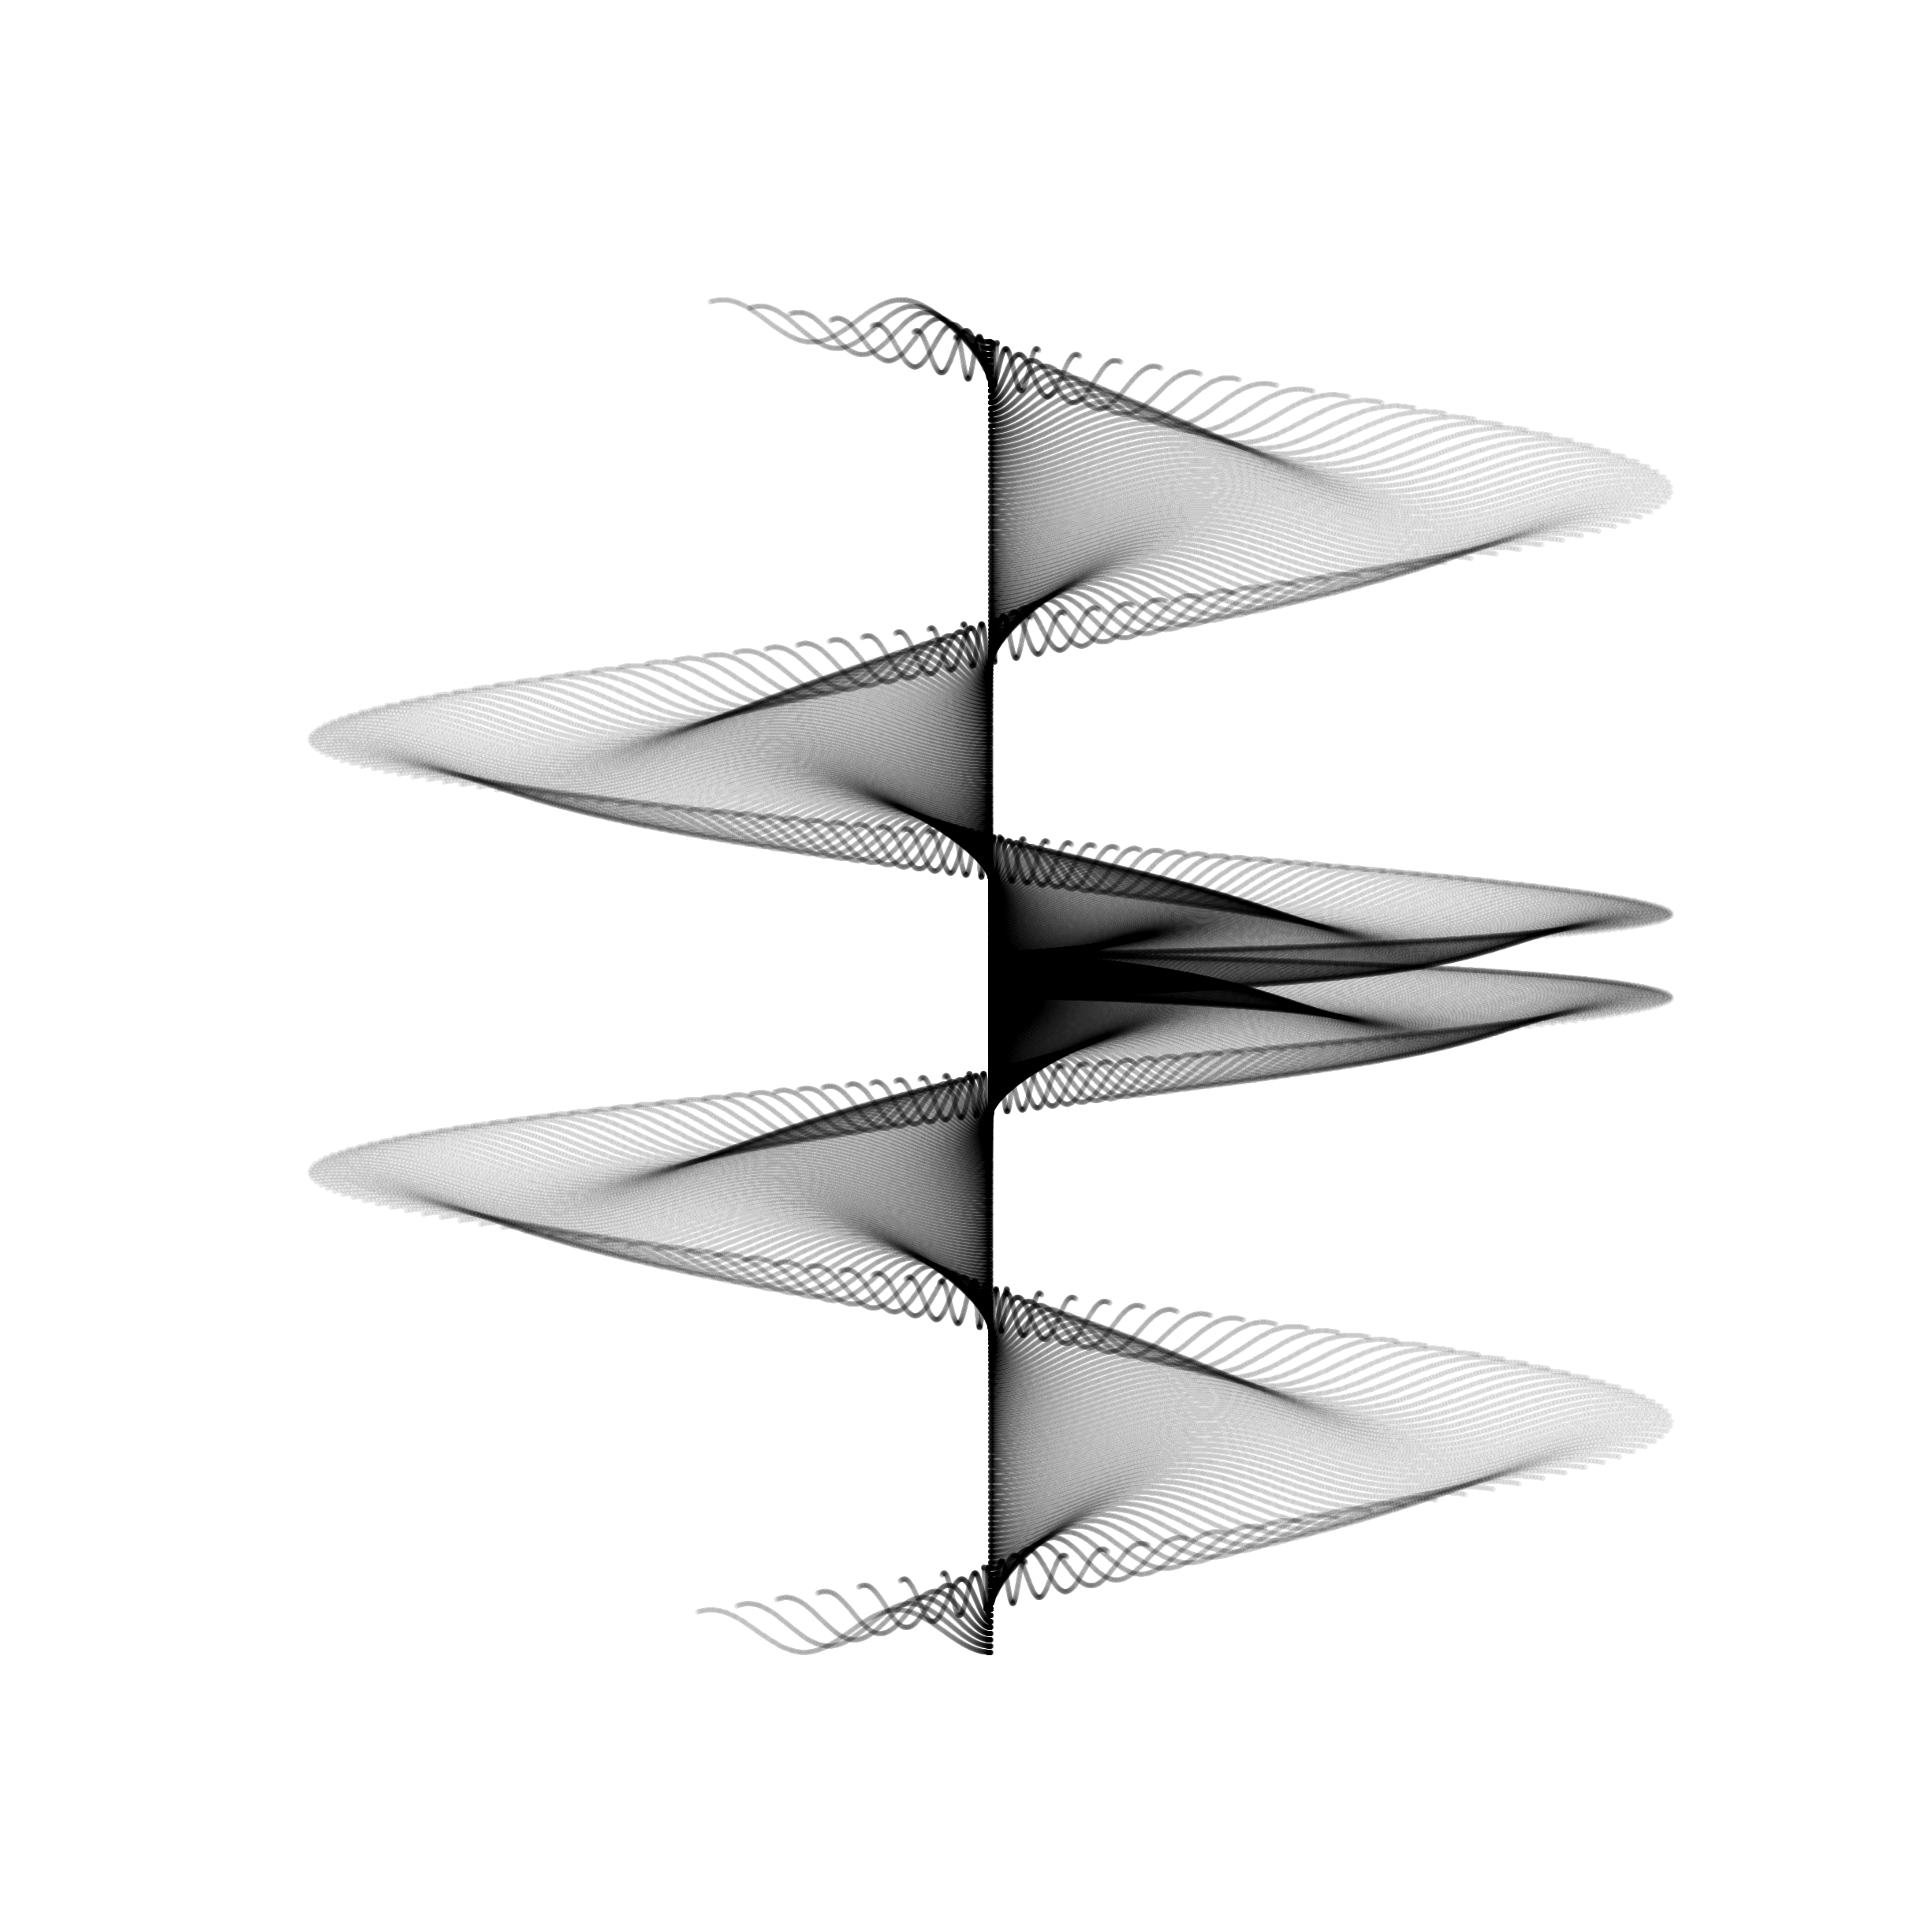
Custom Function
from maige.generator import Generator
xfunc = lambda X, Y: X**2 * np.sin(Y**2)
yfunc = lambda X, Y: Y**3 - np.cos(X**2)
g = Generator(
    projection="rectilinear",
    xfunc=xfunc,
    yfunc=yfunc,
)
fig, ax = g.generate_image("./examples/custom_func.png")
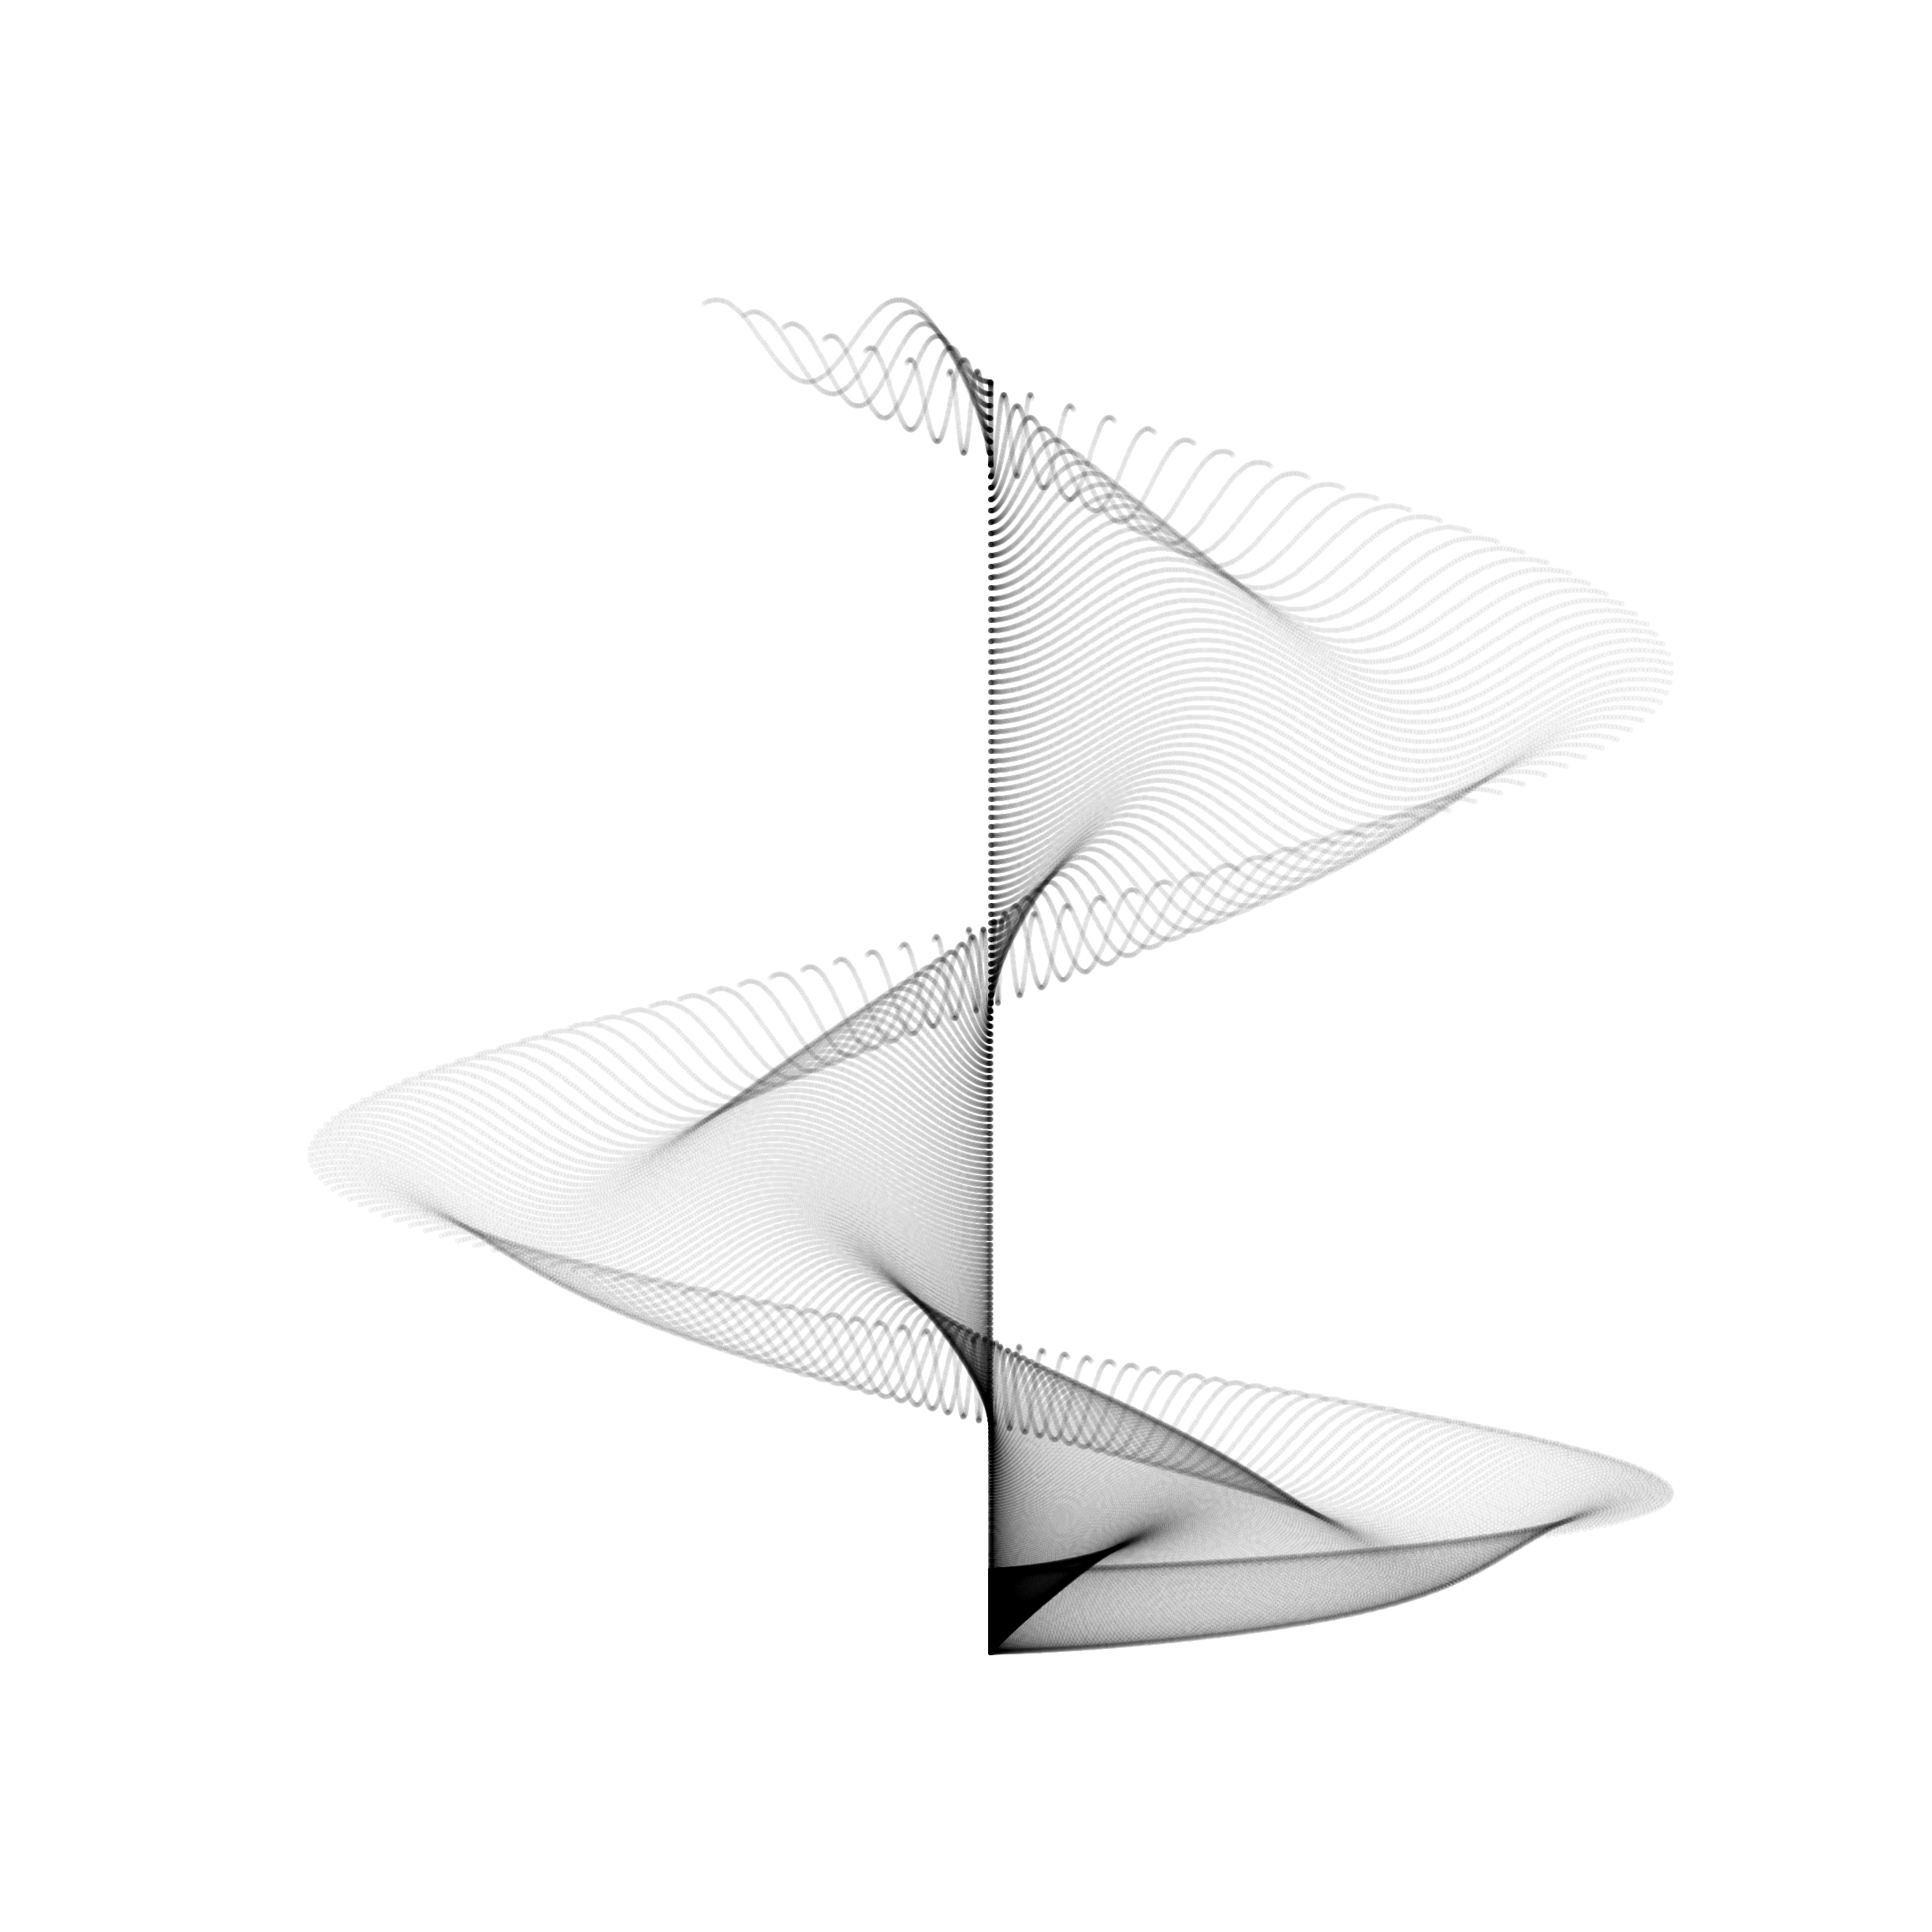
Custom Range
xfunc = lambda X, Y: X**2 * np.sin(Y**2)
yfunc = lambda X, Y: Y**3 - np.cos(X**2)
xrange = np.arange(0, np.pi, 0.01)
yrange = np.arange(0, np.pi, 0.01)
g = Generator(
    projection="polar",
    xfunc=xfunc,
    yfunc=yfunc,
    xrange=xrange,
    yrange=yrange,
)
fig, ax = g.generate_image("./examples/custom_range.png")
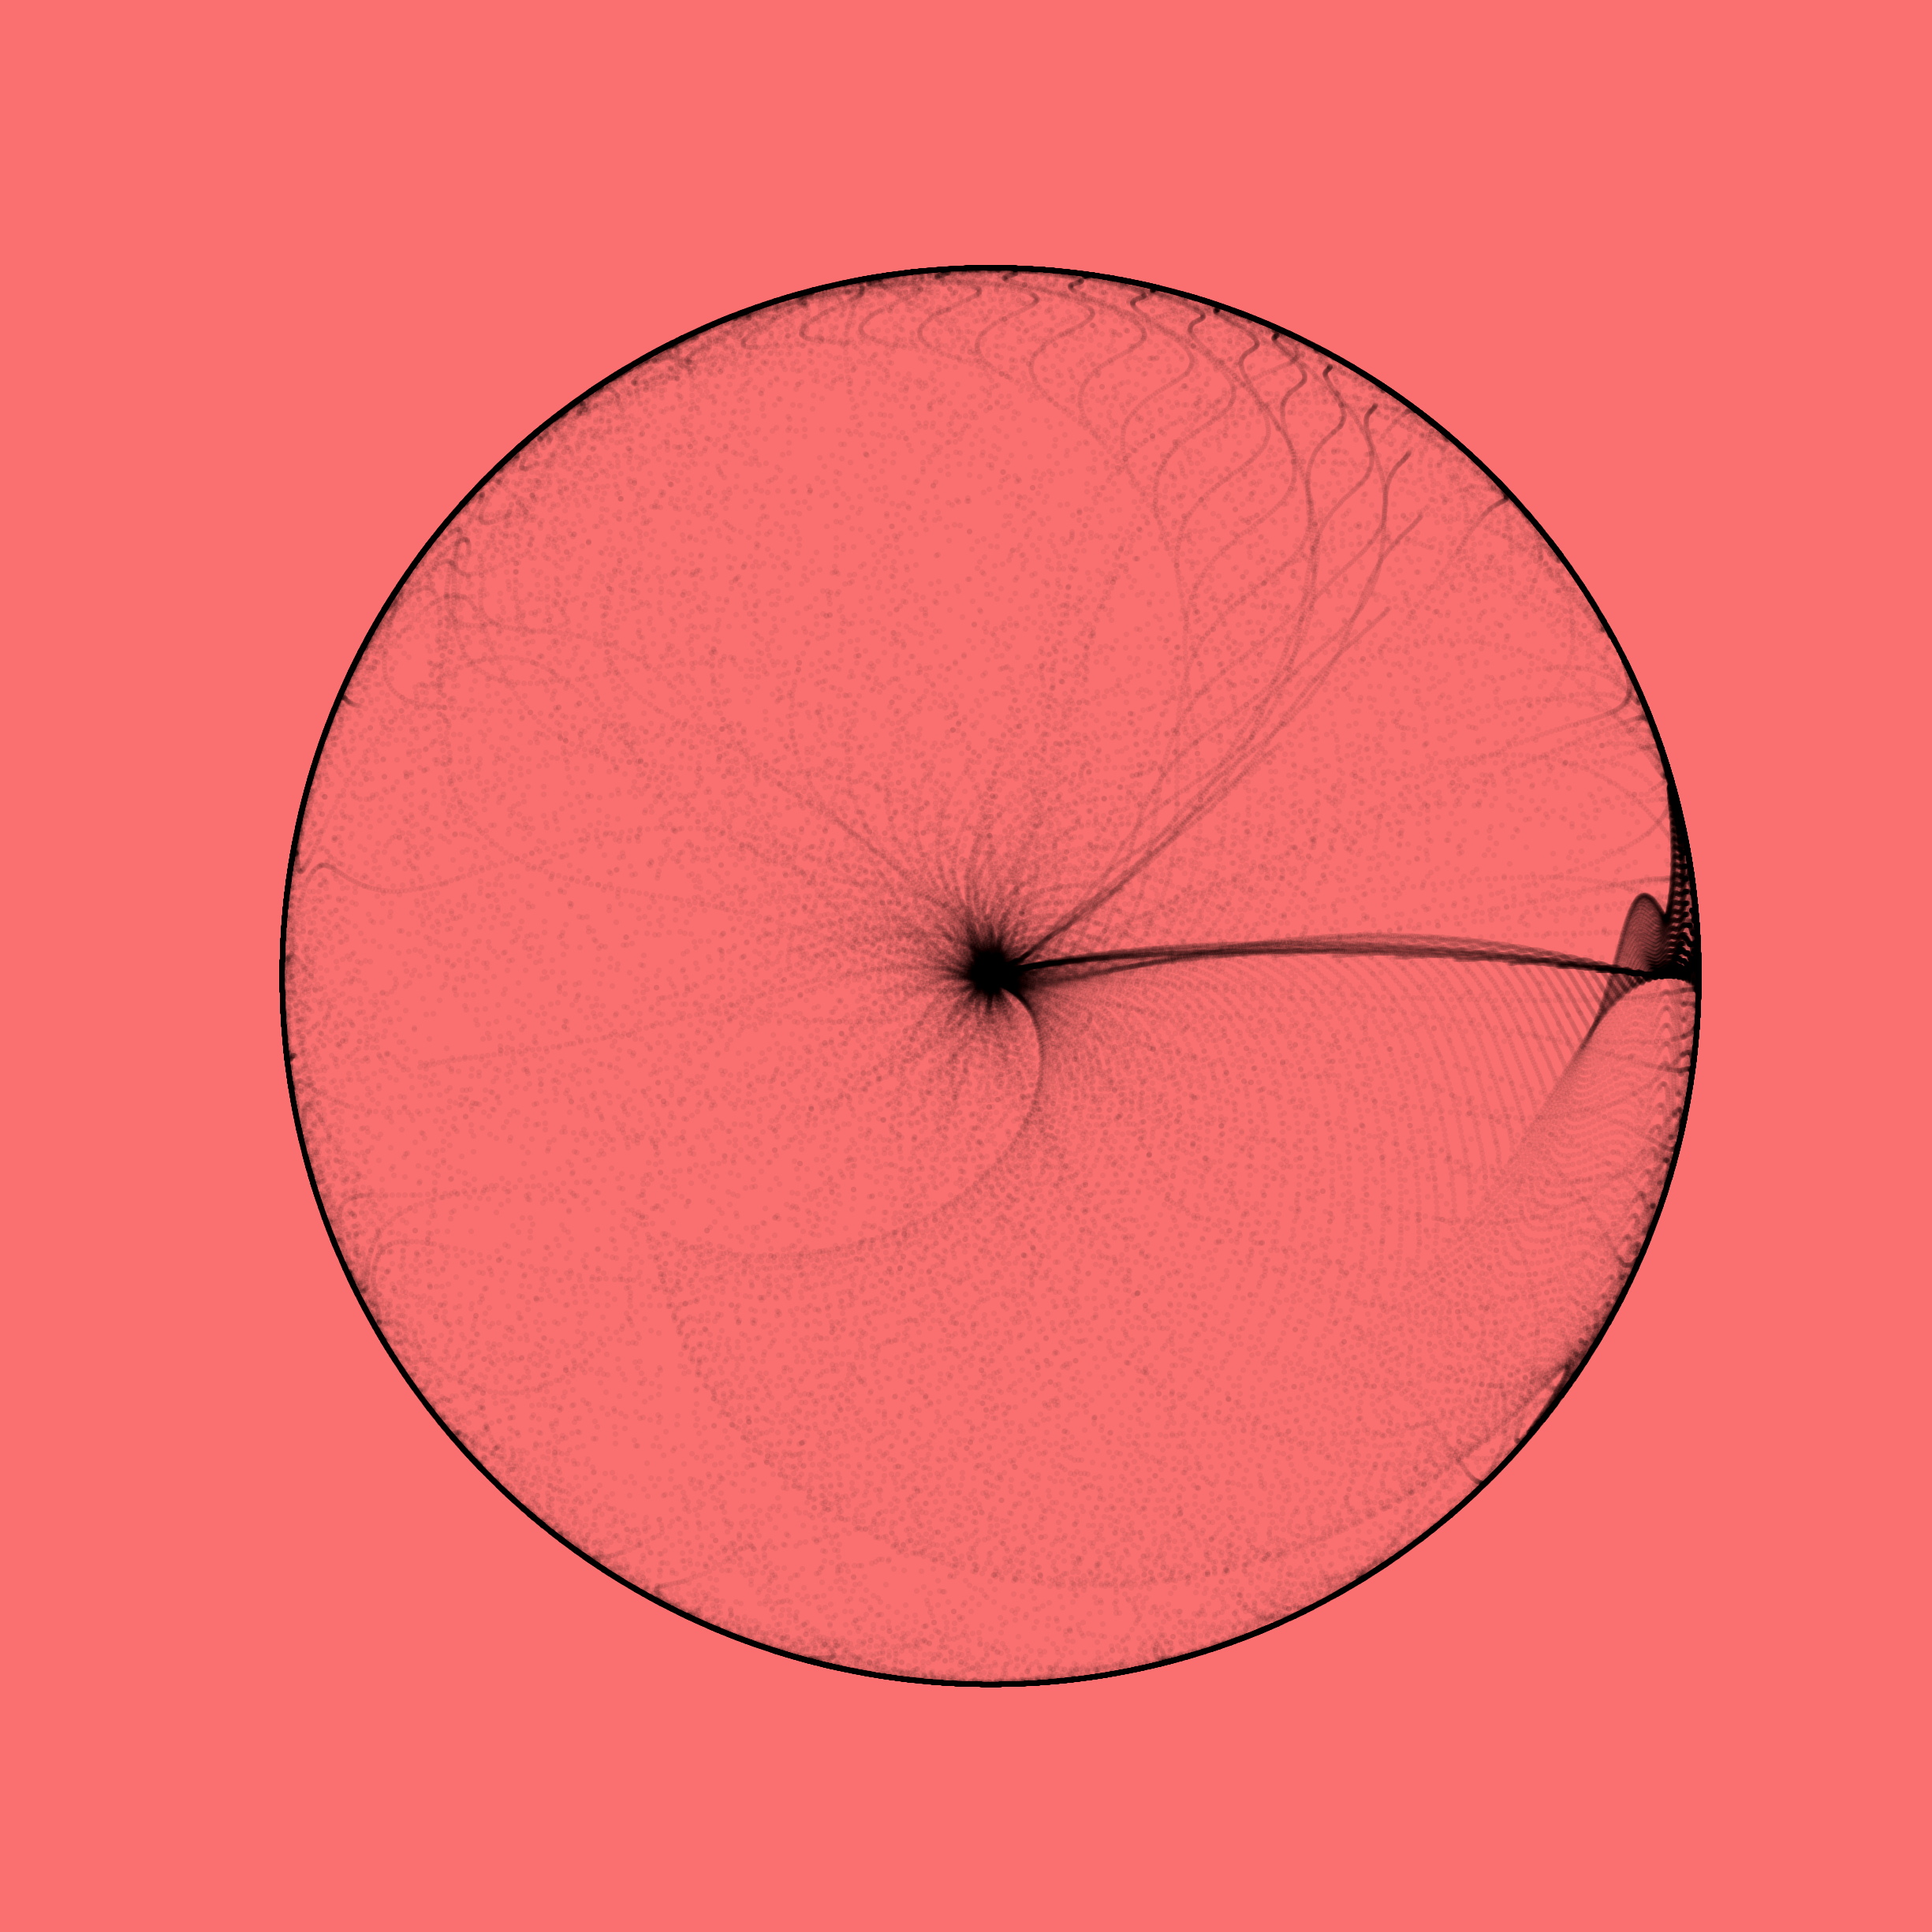
Color
Colors can be customized by providing a individual colors or colormaps from matplotlib.
g = Generator(
    pointcolor="#000000",
    background="#FA7070",
    projection="polar",
)
fig, ax = g.generate_image("./examples/custom_color.png")
Colormap example:
g = Generator(
    projection="polar",
    colormap="viridis",
)
fig, ax = g.generate_image(filepath="./examples/custom_colormap.png")
Animation
xfunc = lambda X, Y: X**2 * np.sin(Y**2)
yfunc = lambda X, Y: Y**3 - np.cos(X**2)
xrange = np.arange(0, np.pi, 0.01)
yrange = np.arange(0, np.pi, 0.01)
g = Generator(
    pointcolor="#ffffff",
    background="#000000",
    projection="polar",
    xfunc=xfunc,
    yfunc=yfunc,
)
g.generate_animation("./examples/anim_example.gif", init_cond="uniform")

Reproducibility
Images and animations can be reproduced by using the JSON stored on the first creation. One can also pass an integer seed to reproduce the same designs over multiple runs.
from maige.generator import Generator

g = Generator(
    seed="./examples/rectilinear.json",
)
fig, ax = g.generate_image("./examples/rectilinear_2.png")
Installation
PyPI
maige can be installed directly from PyPI by using pip or pipenv
pip install maige
or
pipenv install maige
Source
Pipfile and requirements.txt are provided to install virtual environment using pipenv or pip. This can be done by following steps:
$ git clone https://github.com/chahak13/maige.git
$ cd maige
$ pipenv shell
$ pipenv install
If you're pip instead of pipenv, change the last command to pip install -r requirements.txt.