Per-OSD dashboard should include read and write latency
Something like the following:
irate(ceph_osd_op_r_latency_sum[1m]) / on (ceph_daemon) irate(ceph_osd_op_r_latency_count[1m]) * 1000
irate(ceph_osd_op_w_latency_sum[1m]) / on (ceph_daemon) irate(ceph_osd_op_w_latency_count[1m]) * 1000
It might also be nice to have a global latency view on the homepage (perhaps merged w/ the apply vs commit latency graph?).
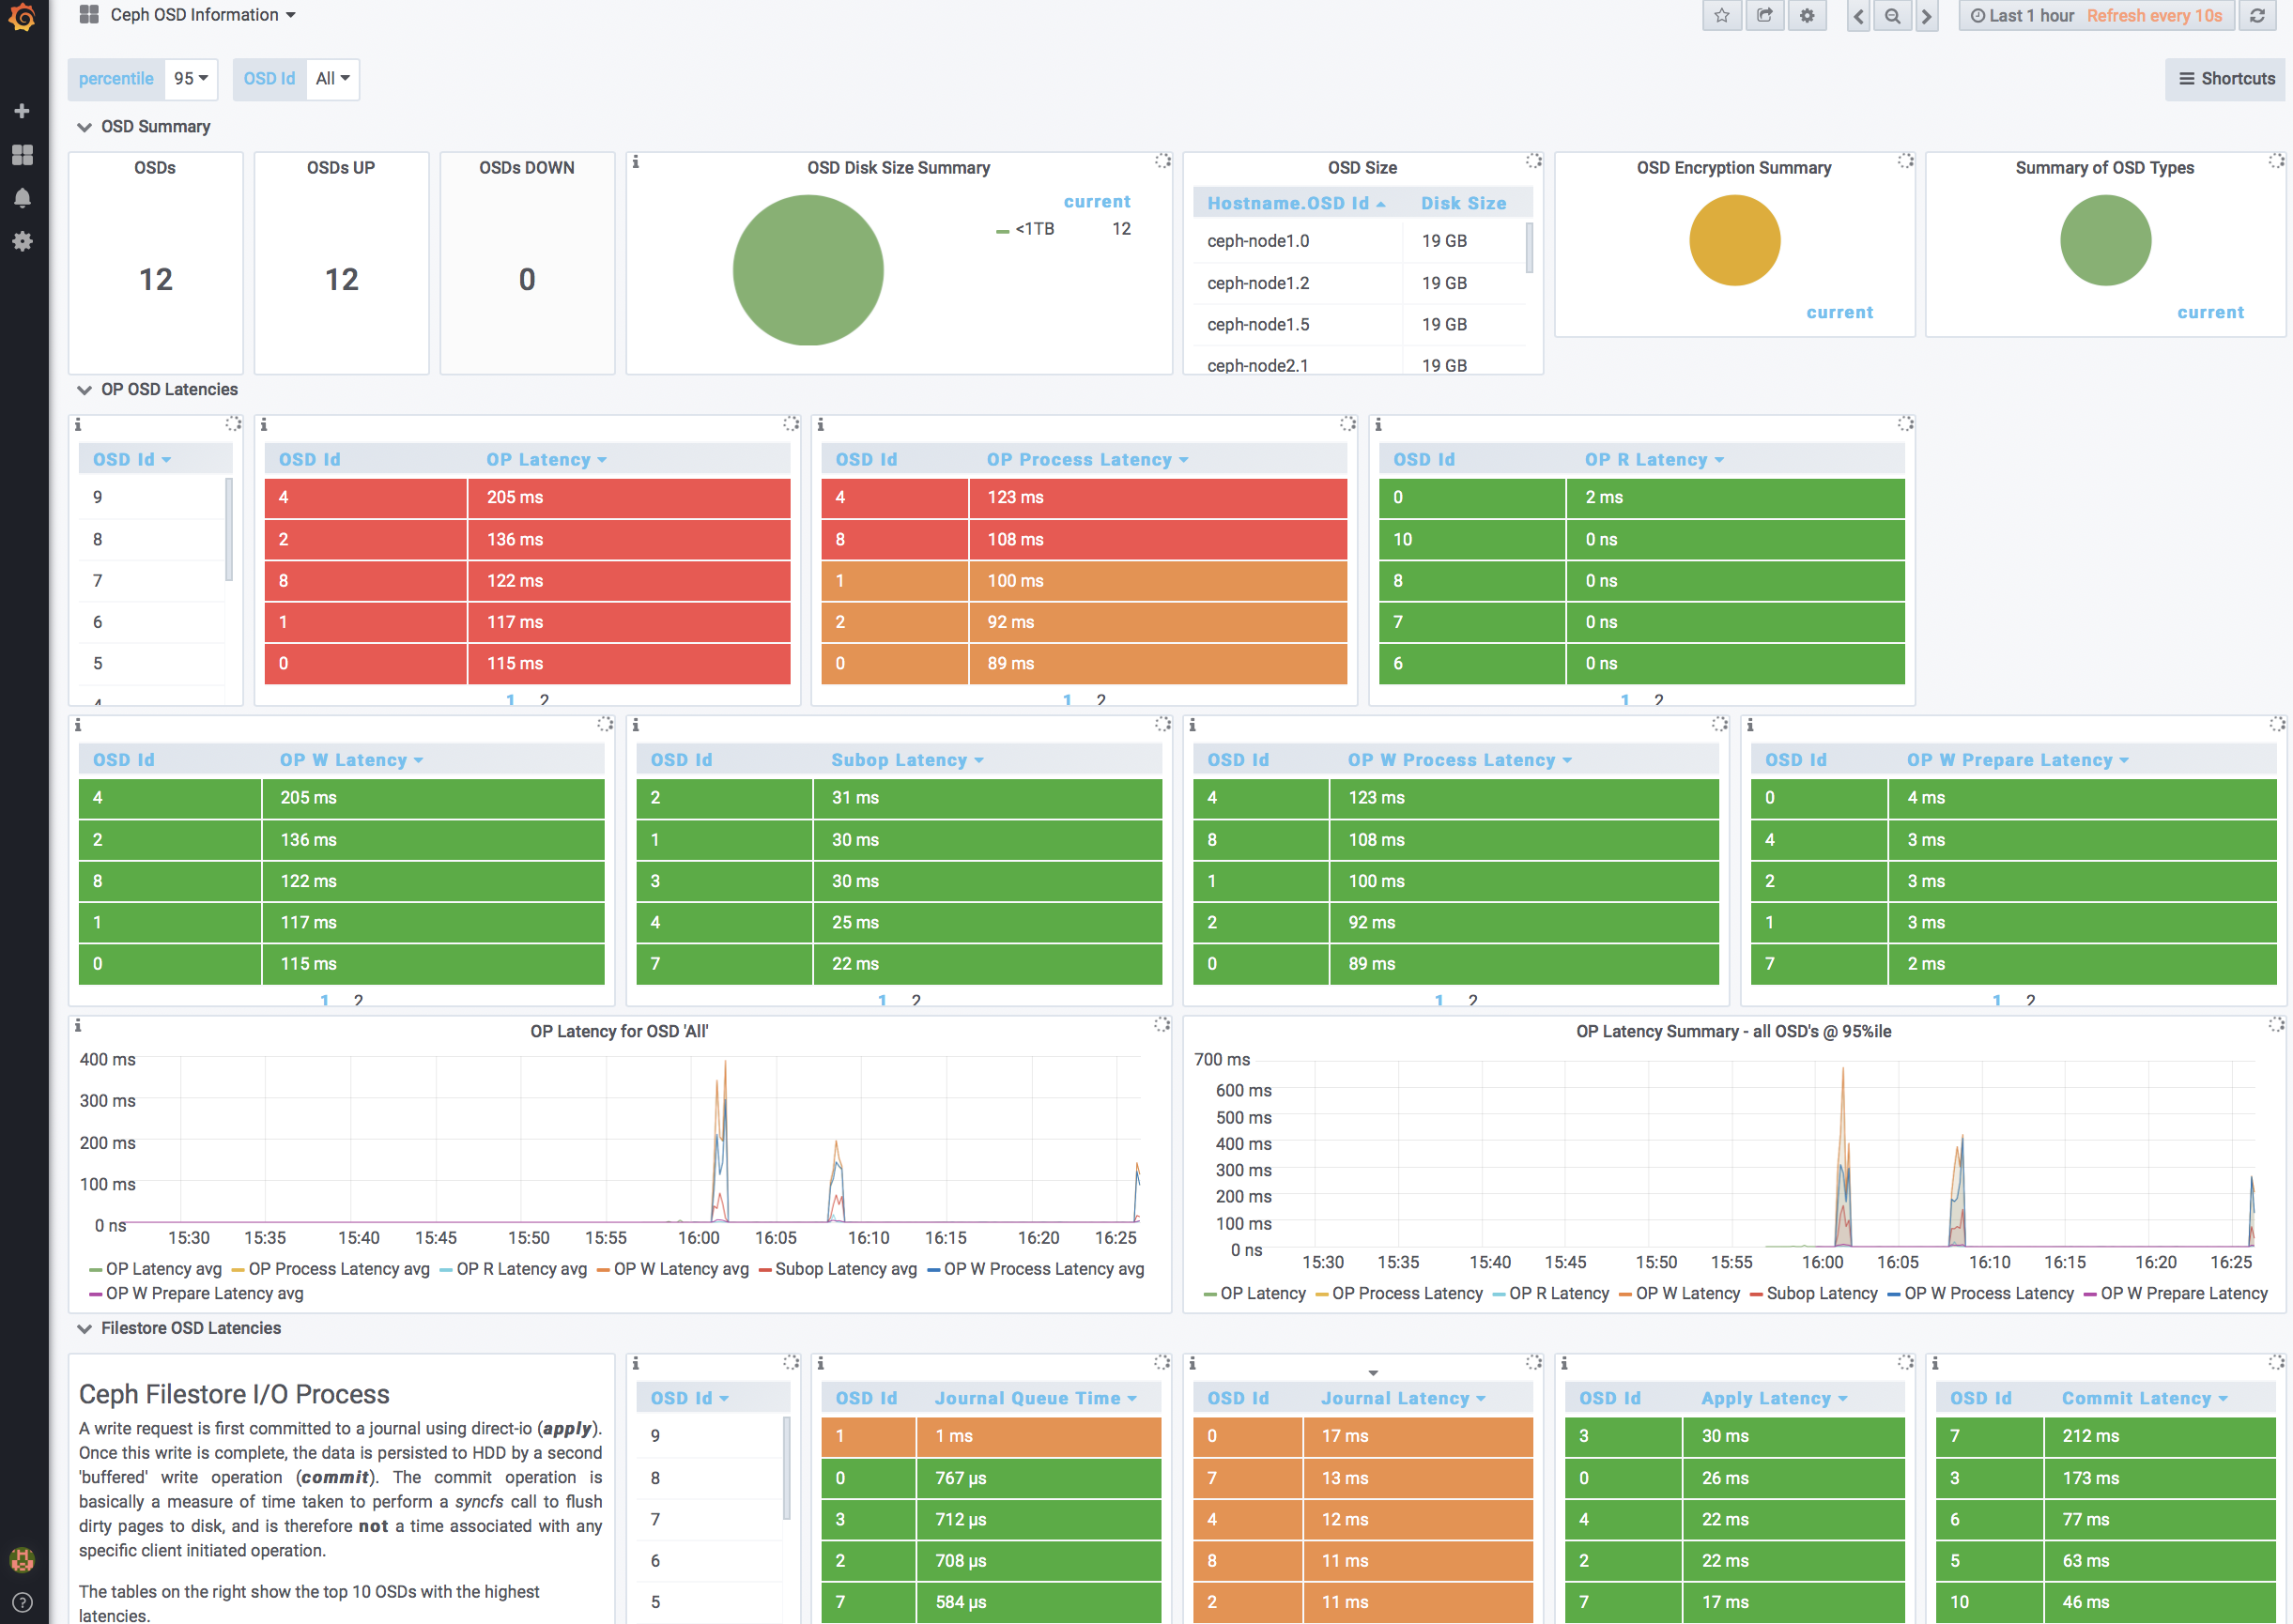
per osd read/write is a good idea. Need to think about the best place to put it though. The ceph osd information dashboard picks up all osd's so in a bigger cluster that'll be a mess. Maybe a percentile view would work under OSD Summary, and add the per osd r/w down into the filestore and bluestore sections that makes use of the osd id pulldown?
Yeah — even if it’s just a top-k high latency graph w/ the ability to drill down into OSDs by host or name if needed perhaps.
It would be nice to have views of both per OSD r/w and top-k high latency graph.
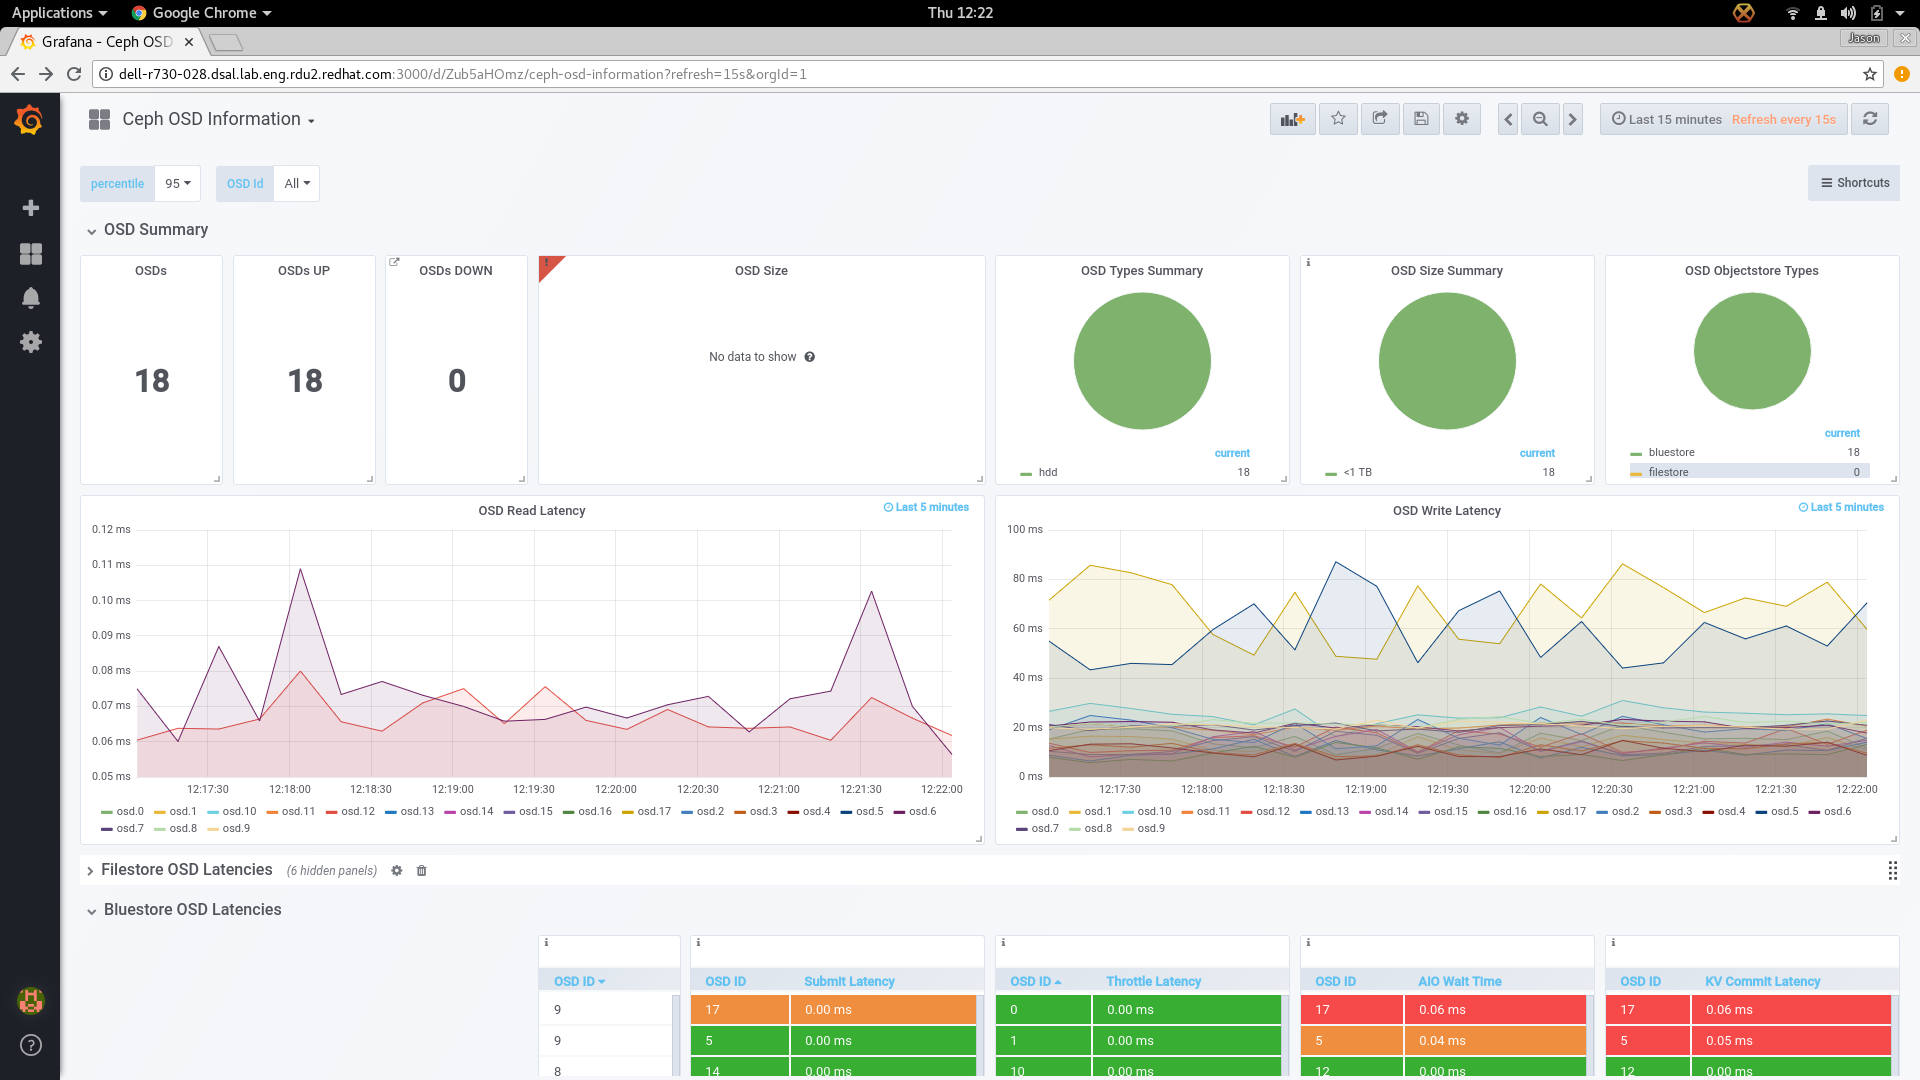
I've quick implemented the per OSD view on the ceph-overview for PoC. It seems very insightful information.