microk8s
 microk8s copied to clipboard
kubelite keeps restarting in a 3-node cluster which is inoperable
Summary
Our 3-node-cluster in a bad shape. All requests to the ingress controller respond with 503, kubectl commands fail from time to time, pods are getting restarted left and right.
I got to the point of pinning this down to the service snap.microk8s.daemon-kubelite restarting every couple of minutes on all nodes. There is always a long go stacktrace, nonzero exit code, and then systemd starting the service back up.
I did not change anything in the cluster, this started happening overnight "by itself".
microk8s status reports all good:
# microk8s status
microk8s is running
high-availability: yes
  datastore master nodes: 94.237.101.145:19001 94.237.34.194:19001 94.237.96.48:19001
  datastore standby nodes: none
inspect also OK
This is how often the service restarts:
# journalctl -u snap.microk8s.daemon-kubelite -f --since 12:00 | grep -i "started service"
Journal file /var/log/journal/system.journal is truncated, ignoring file.
Sep 15 12:00:03 staging-a-3-mks.rohea.com systemd[1]: Started Service for snap application microk8s.daemon-kubelite.
Sep 15 12:00:36 staging-a-3-mks.rohea.com systemd[1]: Started Service for snap application microk8s.daemon-kubelite.
Sep 15 12:04:55 staging-a-3-mks.rohea.com systemd[1]: Started Service for snap application microk8s.daemon-kubelite.
Sep 15 12:09:37 staging-a-3-mks.rohea.com systemd[1]: Started Service for snap application microk8s.daemon-kubelite.
Sep 15 12:14:59 staging-a-3-mks.rohea.com systemd[1]: Started Service for snap application microk8s.daemon-kubelite.
Sep 15 12:25:06 staging-a-3-mks.rohea.com systemd[1]: Started Service for snap application microk8s.daemon-kubelite.
Sep 15 12:30:12 staging-a-3-mks.rohea.com systemd[1]: Started Service for snap application microk8s.daemon-kubelite.
Sep 15 12:34:00 staging-a-3-mks.rohea.com systemd[1]: Started Service for snap application microk8s.daemon-kubelite.
Introspection Report
Node 1
# microk8s inspect
Inspecting Certificates
Inspecting services
  Service snap.microk8s.daemon-cluster-agent is running
  Service snap.microk8s.daemon-containerd is running
  Service snap.microk8s.daemon-apiserver-kicker is running
  Service snap.microk8s.daemon-kubelite is running
  Copy service arguments to the final report tarball
Inspecting AppArmor configuration
Gathering system information
  Copy processes list to the final report tarball
  Copy snap list to the final report tarball
  Copy VM name (or none) to the final report tarball
  Copy disk usage information to the final report tarball
  Copy memory usage information to the final report tarball
  Copy server uptime to the final report tarball
  Copy current linux distribution to the final report tarball
  Copy openSSL information to the final report tarball
  Copy network configuration to the final report tarball
Inspecting kubernetes cluster
  Inspect kubernetes cluster
Inspecting juju
  Inspect Juju
Inspecting kubeflow
  Inspect Kubeflow

Building the report tarball
  Report tarball is at /var/snap/microk8s/3695/inspection-report-20220915_144656.tar.gz
inspection-report-20220915_144656.tar.gz
Node 2
inspection-report-20220915_145106.tar.gz
Node 3
inspection-report-20220915_144557.tar.gz
Can you suggest a fix?
From the Slack thread where I initially reported this:
First glance, it looks like the data store isn't healthy. But couldn't find the reason why.
I see this error ERROR: problem running iptables: Another app is currently holding the xtables lock. Perhaps you want to use the -w option? Then kubelite restarts...
^ Although that is not always the case, in some cases kubelite restarts without the iptables error
I see this xtable lock log when iptables command is called by the inspect script. Its in the network directory of your inspect tarball. Then i see a bunch of these logs
Sep 15 11:27:03 [staging-a-1-mks.rohea.com](http://staging-a-1-mks.rohea.com/) microk8s.daemon-kubelite[436414]: time="2022-09-15T11:27:03Z" level=error msg="fail to list latest changes: query (try: 0): call query-sql (budget 0s): receive: header: EOF"
It looks similar to this https://github.com/canonical/go-dqlite/issues/182
Hi @melkamar I see in the sys logs (dmesg) a few meddages like this:
[ 5187.228904] relay invoked oom-killer: gfp_mask=0xcc0(GFP_KERNEL), order=0, oom_score_adj=999
[ 5187.228915] CPU: 1 PID: 128916 Comm: relay Not tainted 5.11.0-38-generic #42~20.04.1-Ubuntu
[ 5187.228919] Hardware name: UpCloud Cloud Server, BIOS 1.12.0-1 04/01/2014
[ 5187.228921] Call Trace:
[ 5187.228927]  dump_stack+0x74/0x92
[ 5187.228935]  dump_header+0x4f/0x1f6
[ 5187.228938]  oom_kill_process.cold+0xb/0x10
[ 5187.228940]  out_of_memory.part.0+0x1ee/0x460
[ 5187.228946]  out_of_memory+0x6d/0xd0
[ 5187.228948]  mem_cgroup_out_of_memory+0xe4/0x100
[ 5187.228953]  try_charge+0x701/0x740
[ 5187.228955]  mem_cgroup_charge+0x8a/0x270
[ 5187.228956]  do_anonymous_page+0x111/0x3b0
[ 5187.228961]  __handle_mm_fault+0x8cc/0x920
[ 5187.228962]  handle_mm_fault+0xd7/0x2b0
[ 5187.228964]  do_user_addr_fault+0x1a0/0x450
[ 5187.228968]  exc_page_fault+0x69/0x150
[ 5187.228972]  ? asm_exc_page_fault+0x8/0x30
[ 5187.228976]  asm_exc_page_fault+0x1e/0x30
[ 5187.228978] RIP: 0033:0x7fa9fa0ee380
[ 5187.228981] Code: 6f 01 c5 fe 6f 49 e0 c5 fe 6f 51 c0 c5 fe 6f 59 a0 48 81 e9 80 00 00 00 48 81 ea 80 00 00 00 c4 c1 7d 7f 01 c4 c1 7d 7f 49 e0 <c4> c1 7d 7f 51 c0 c4 c1 7d 7f 59 a0 49 81 e9 80 00 00 00 48 81 fa
[ 5187.228983] RSP: 002b:00007fa9f84724b8 EFLAGS: 00010202
[ 5187.228985] RAX: 00007fa9ebe5d950 RBX: 00007fa9ebe34920 RCX: 00007fa9ebe54f80
[ 5187.228986] RDX: 0000000000020670 RSI: 00007fa9ebe34930 RDI: 00007fa9ebe5d950
[ 5187.228987] RBP: 00007fa9ebe5c930 R08: 0000000000000018 R09: 00007fa9ebe7e020
[ 5187.228988] R10: fffffffffffff000 R11: 00007fa9ebe85938 R12: 00007fa9e8000020
[ 5187.228989] R13: 0000000000000000 R14: 00007fa9ebe5d950 R15: 0000000000028010
[ 5187.228992] memory: usage 65536kB, limit 65536kB, failcnt 109
[ 5187.228993] memory+swap: usage 65536kB, limit 9007199254740988kB, failcnt 0
[ 5187.228995] kmem: usage 1020kB, limit 9007199254740988kB, failcnt 0
[ 5187.228995] Memory cgroup stats for /kubepods/burstable/poda975d534-88ee-43ab-9221-164e6905caf6/1a0c73c44d0b074e96b01d562af0551cbadfda095645f6b305bc70dde093576a:
[ 5187.229013] anon 65961984
               file 0
               kernel_stack 245760
Is it possible the node is running out of memory and the kernel is killing processes?
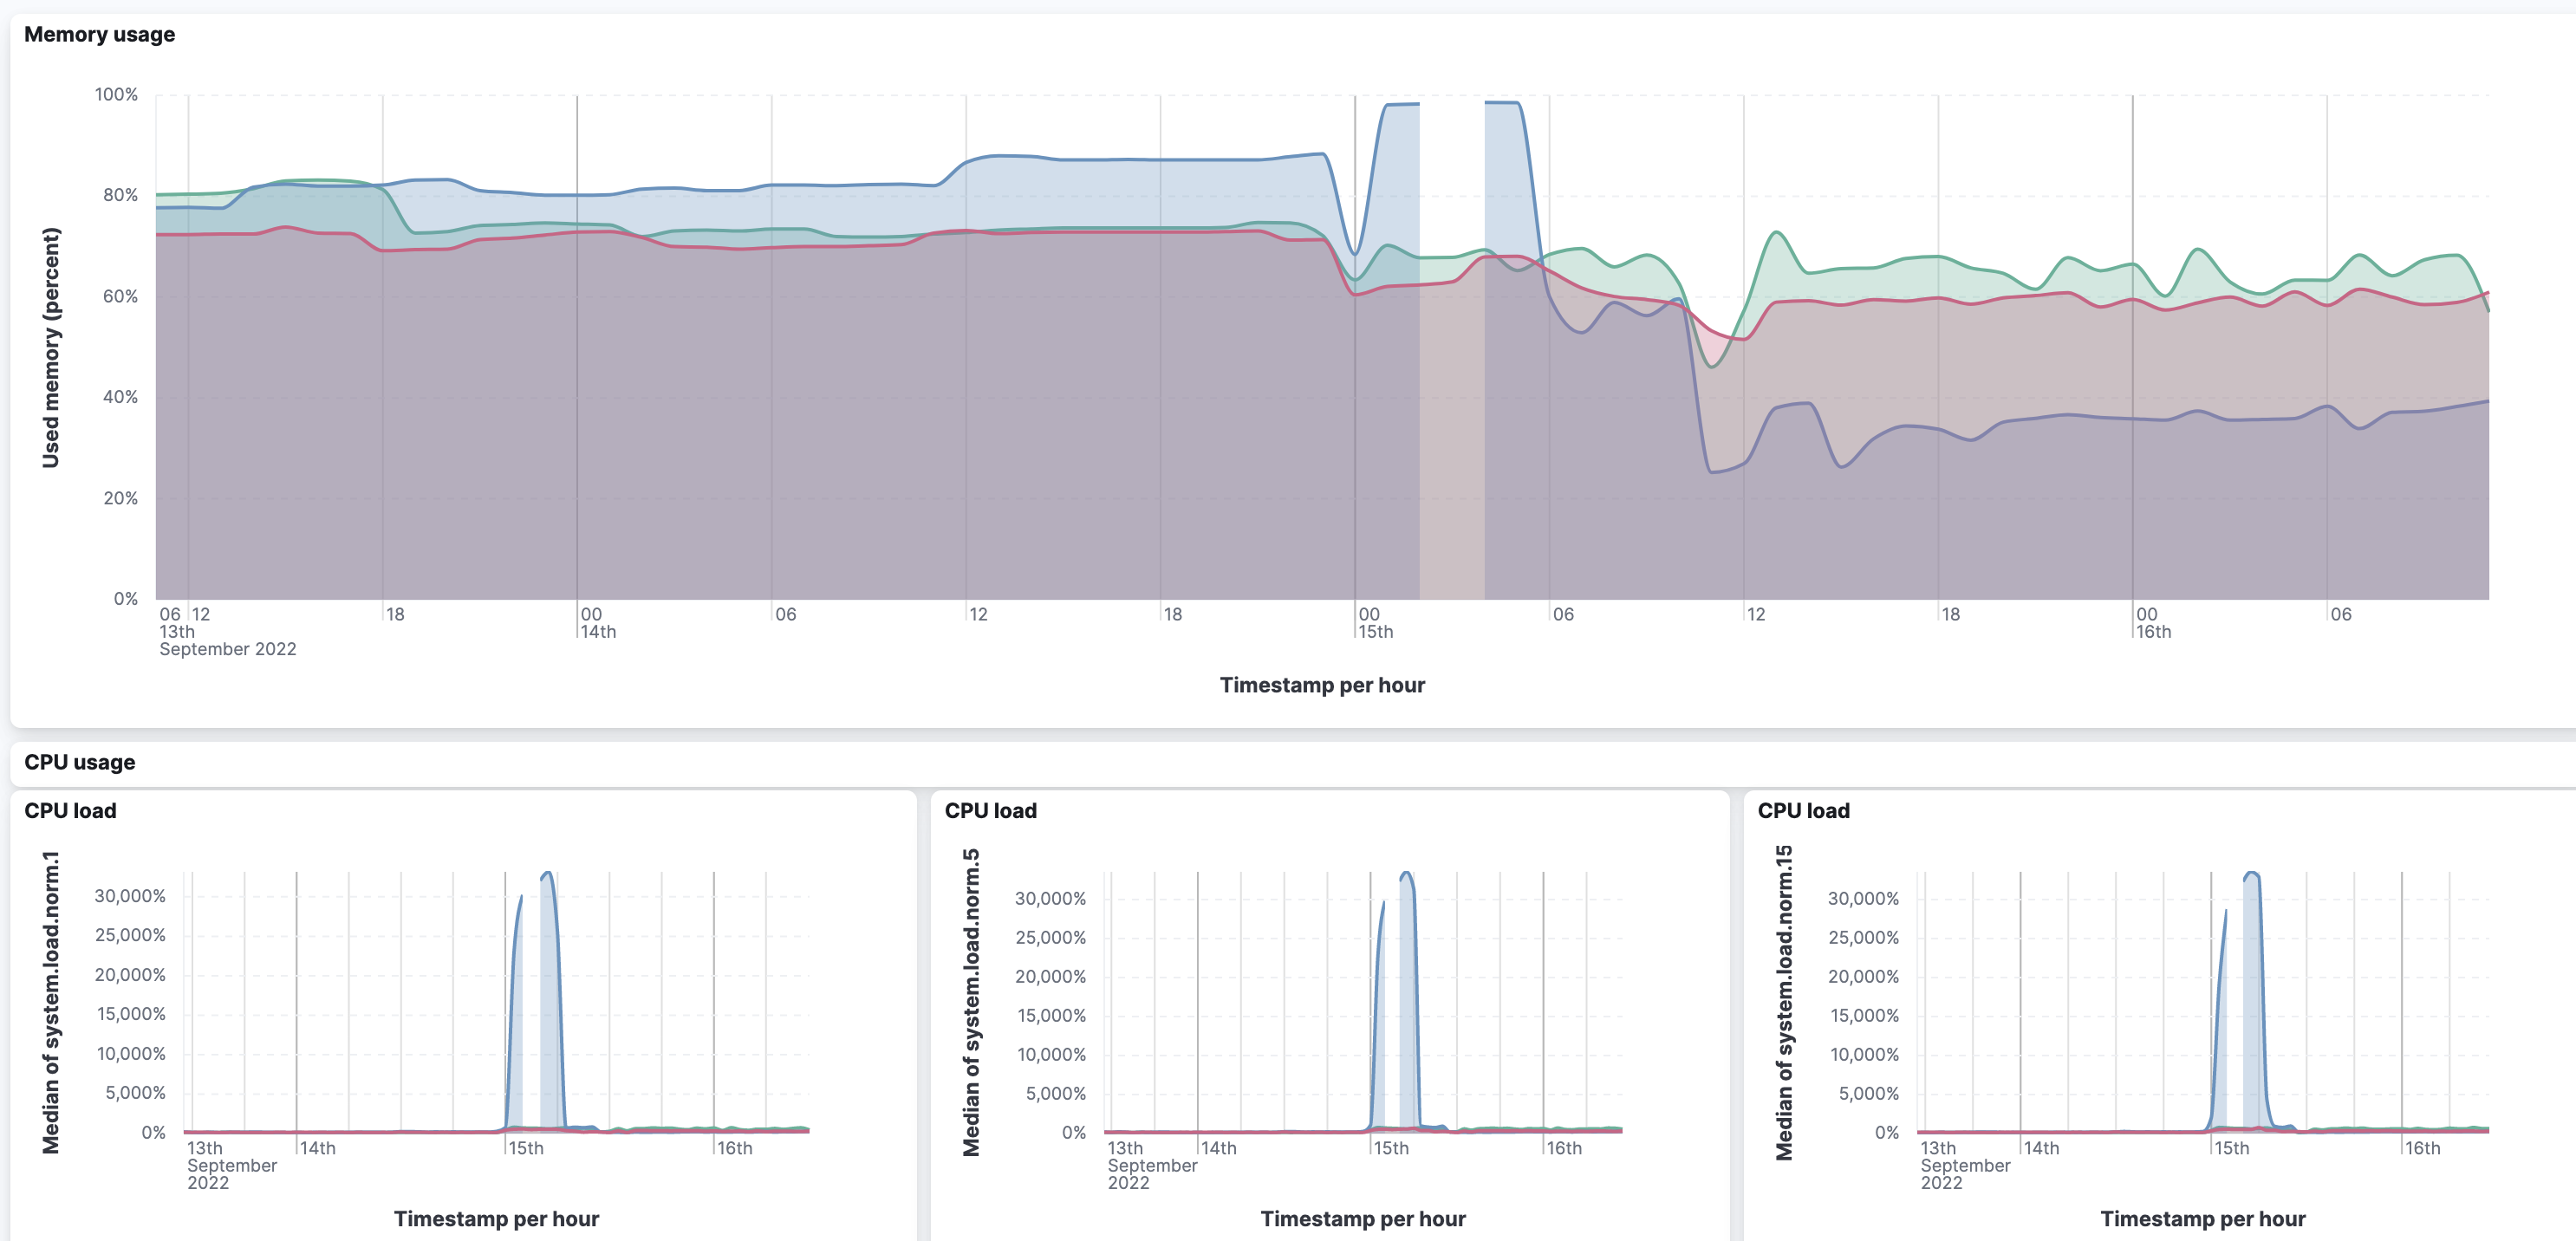
Looking at the metrics, running out of memory seems to be the reason this started happening in the first place (around midnight from 14th to 15th Sep), but not anymore. Even when I ssh into the node and watch the cpu/mem with htop, the mem has a lot of headroom. (The first graph is stats of just the main/leader node)
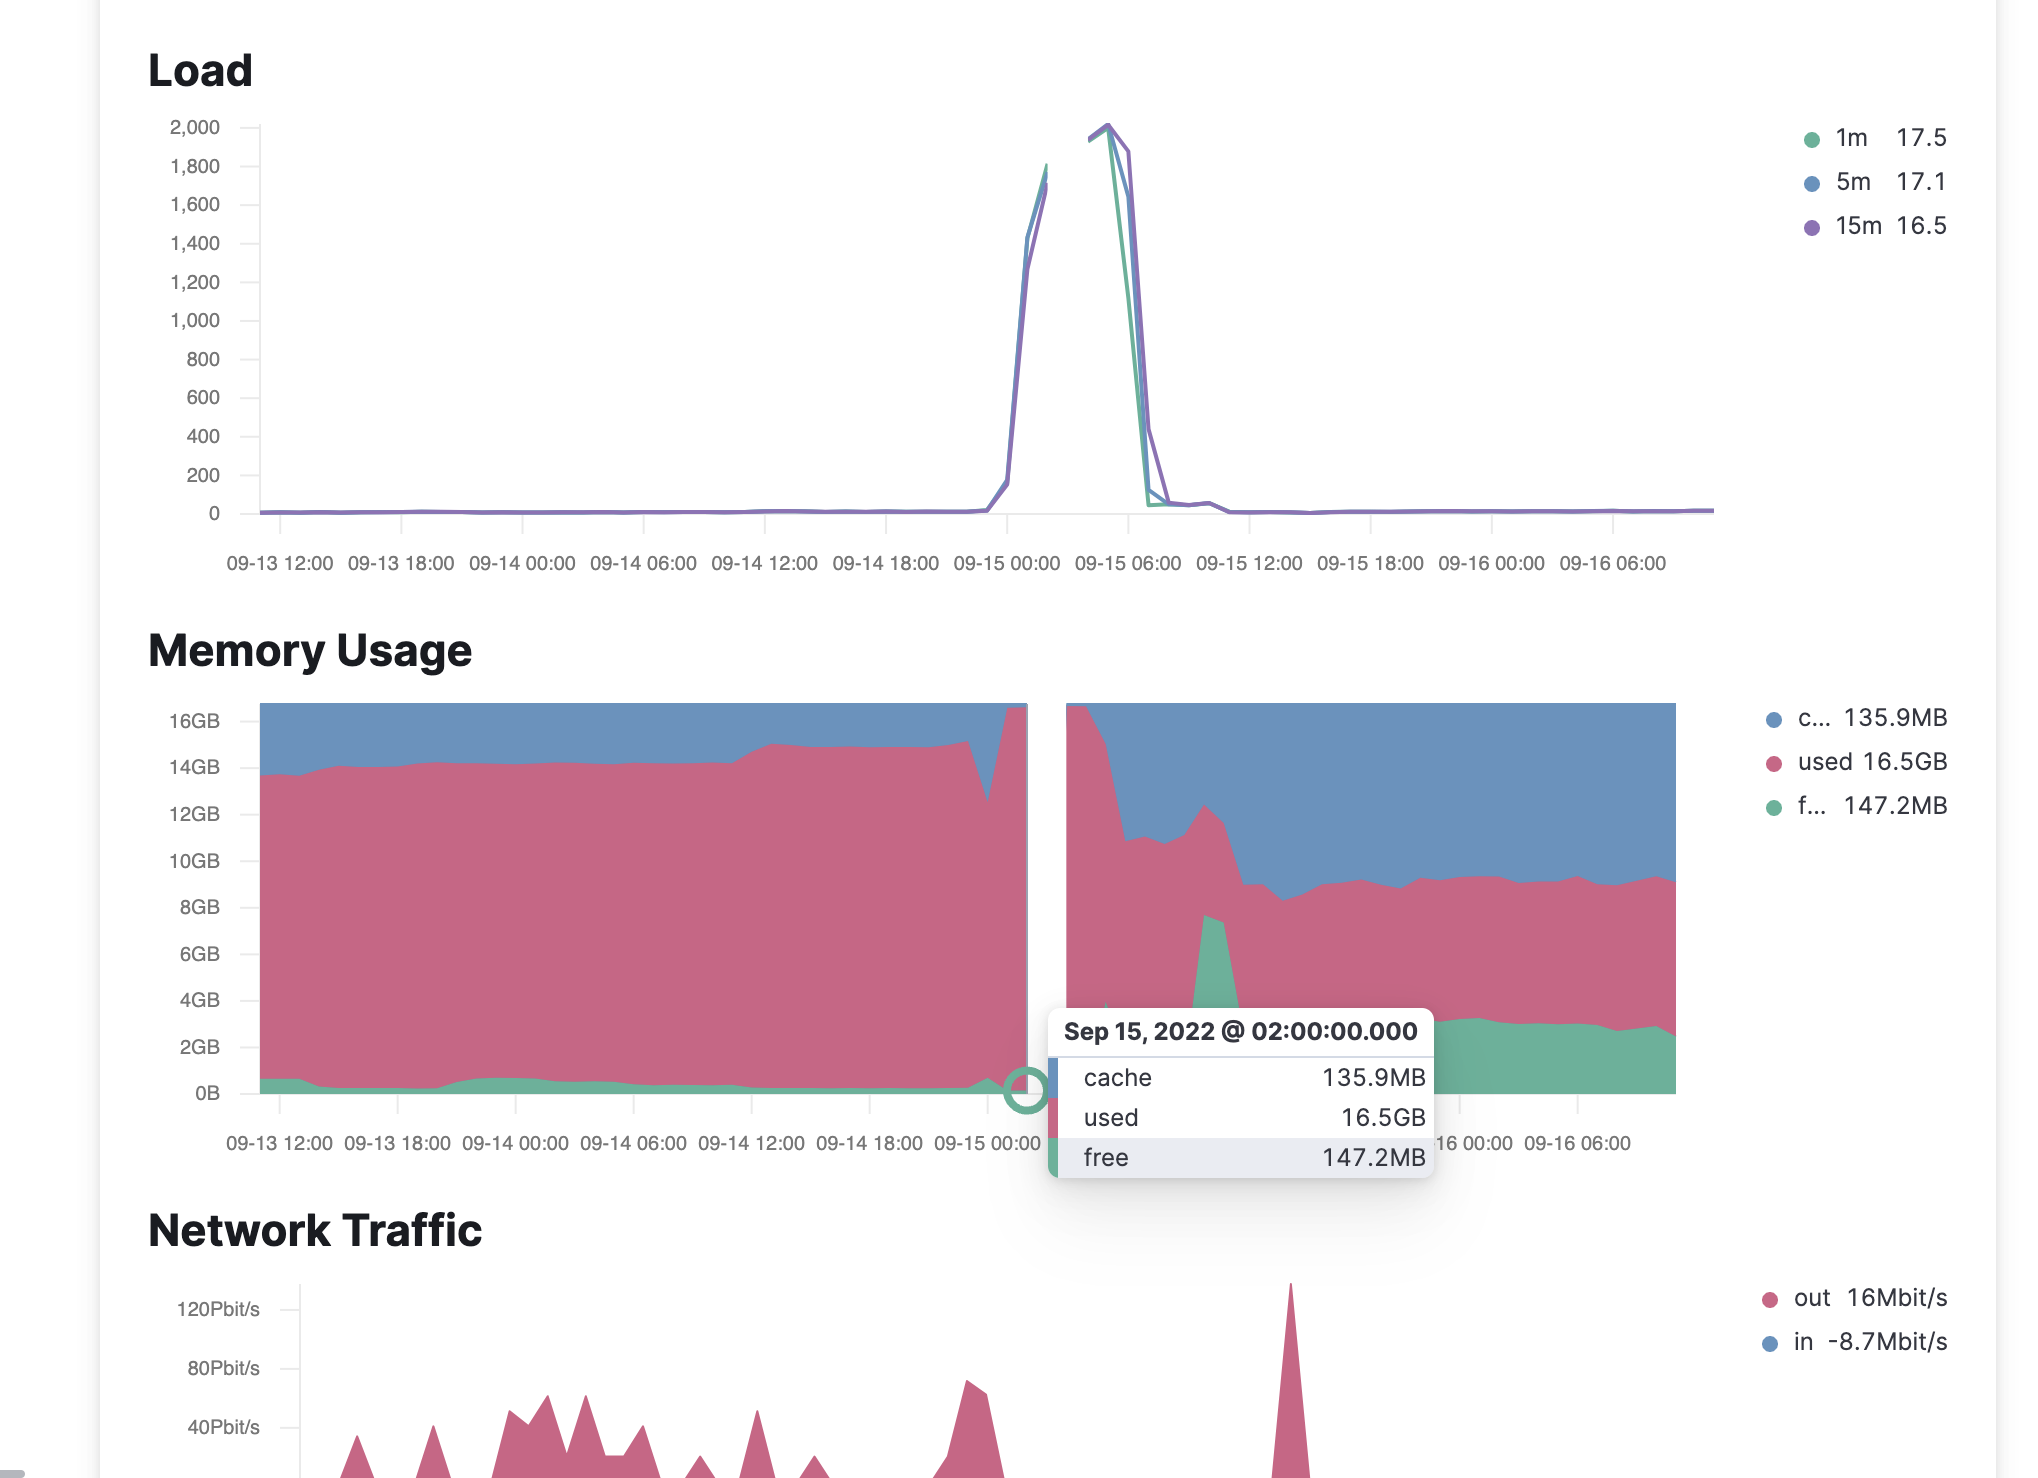
Also, looking at the second graph, the main node is the only one where the memory ran out, the others never came close to it.
I wonder if that crash could have left the dqlite in a bad state?
I have had the out-of-memory situation happen before, node restart helped and the cluster always recovered. (I had spent some time trying to configure the microk8s setup to not reach that point but that's a separate issue/question)
After increasing the memory from 16 to 32 GB, the same thing keeps happening, kubelite keeps restarting.
Noticed a bunch of http timeouts in the kubelite logs though:
microk8s.daemon-kubelite[976]: E0916 09:50:13.985748     976 writers.go:117] apiserver was unable to write a JSON response: http: Handler timeout
microk8s.daemon-kubelite[976]: E0916 09:50:14.000381     976 status.go:71] apiserver received an error that is not an metav1.Status: &errors.errorString{s:"http: Handler timeout"}: http: Handler timeout
microk8s.daemon-kubelite[976]: E0916 09:50:14.003079     976 writers.go:130] apiserver was unable to write a fallback JSON response: http: Handler timeout
microk8s.daemon-kubelite[976]: E0916 09:50:14.049208     976 timeout.go:139] post-timeout activity - time-elapsed: 139.040589ms, POST "/api/v1/namespaces/metallb-system/serviceaccounts/controller/token" result: <nil>
Don't know if related to the iptables errors in the original question? The internet traffic among nodes works OK, ping responds in all directions.
Some more bits in the syslog, there were some problems with starting the networking service (there were some cloud provider problems that day, possibly related):
Sep 15 04:54:37 staging-a-1-mks.rohea.com systemd-networkd[1932013]: eth1: Gained IPv6LL
Sep 15 04:54:37 staging-a-1-mks.rohea.com systemd-networkd[1932013]: eth0: Gained IPv6LL
Sep 15 04:54:37 staging-a-1-mks.rohea.com systemd-networkd[1932013]: Could not enumerate neighbors: Device or resource busy
Sep 15 04:54:37 staging-a-1-mks.rohea.com kernel: [3273207.418660] oom_reaper: reaped process 1923285 (php), now anon-rss:0kB, file-rss:0kB, shmem-rss:0kB
Sep 15 04:54:37 staging-a-1-mks.rohea.com systemd[1]: systemd-networkd.service: Main process exited, code=exited, status=1/FAILURE
Sep 15 04:54:37 staging-a-1-mks.rohea.com systemd[1]: systemd-networkd.service: Failed with result 'exit-code'.
Sep 15 04:54:37 staging-a-1-mks.rohea.com systemd[1]: Failed to start Network Service.
Sep 15 04:54:37 staging-a-1-mks.rohea.com systemd[1]: systemd-networkd.service: Scheduled restart job, restart counter is at 56.
Sep 15 04:54:37 staging-a-1-mks.rohea.com systemd[1]: Stopped Network Service.
Sep 15 04:54:37 staging-a-1-mks.rohea.com systemd[1]: Starting Network Service...
But this was happening for a limited amount of time, not anymore.
From what i can see, it is not the case where dqlite always fails. As an example:
Sep 15 14:45:33 staging-a-3-mks.rohea.com microk8s.daemon-kubelite[1151132]: I0915 14:45:33.604727 1151132 trace.go:205] Trace[1726931916]: "Create" url:/api/v1/namespaces/kube-system/serviceaccounts/node-controller/token,user-agent:kubelite/v1.22.13 (linux/amd64) kubernetes/bfd5f06/kube-controller-manager,audit-id:759bcfe7-da56-485c-a987-3df61ada8cae,client:127.0.0.1,accept:application/vnd.kubernetes.protobuf, */*,protocol:HTTP/2.0 (15-Sep-2022 14:45:29.278) (total time: 4326ms):
Sep 15 14:45:33 staging-a-3-mks.rohea.com microk8s.daemon-kubelite[1151132]: Trace[1726931916]: ---"Object stored in database" 4325ms (14:45:33.604)
Sep 15 14:45:33 staging-a-3-mks.rohea.com microk8s.daemon-kubelite[1151132]: Trace[1726931916]: [4.326150859s] [4.326150859s] END
This seem to indicate that it was able to save the content in the database. The restart can be due to the controller manager unable to do leader election. Like this:
Sep 15 14:14:23 staging-a-3-mks.rohea.com microk8s.daemon-kubelite[1007360]: F0915 14:14:23.073580 1007360 controllermanager.go:287] leaderelection lost
Sep 15 14:14:23 staging-a-3-mks.rohea.com microk8s.daemon-kubelite[1007360]: {"level":"warn","ts":"2022-09-15T14:14:23.521Z","logger":"etcd-client","caller":"v3/retry_interceptor.go:62","msg":"retrying of unary invoker failed","target":"etcd-endpoints://0xc002638e00/#initially=[unix:///var/snap/microk8s/3695/var/kubernetes/backend//kine.sock]","attempt":0,"error":"rpc error: code = Canceled desc = context canceled"}
Sep 15 14:14:24 staging-a-3-mks.rohea.com microk8s.daemon-kubelite[1007360]: {"level":"warn","ts":"2022-09-15T14:14:24.161Z","logger":"etcd-client","caller":"v3/retry_interceptor.go:62","msg":"retrying of unary invoker failed","target":"etcd-endpoints://0xc0010c0a80/#initially=[unix:///var/snap/microk8s/3695/var/kubernetes/backend//kine.sock]","attempt":0,"error":"rpc error: code = Unimplemented desc = unknown service etcdserverpb.Maintenance"}
Sep 15 14:14:25 staging-a-3-mks.rohea.com microk8s.daemon-kubelite[1007360]: goroutine 29532 [running]:
Sep 15 14:14:25 staging-a-3-mks.rohea.com microk8s.daemon-kubelite[1007360]: k8s.io/kubernetes/vendor/k8s.io/klog/v2.stacks(0xc000136001, 0xc02538f180, 0x4c, 0x12d)
Sep 15 14:14:25 staging-a-3-mks.rohea.com microk8s.daemon-kubelite[1007360]:         /build/microk8s/parts/k8s-binaries/build/go/src/github.com/kubernetes/kubernetes/_output/local/go/src/k8s.io/kubernetes/vendor/k8s.io/klog/v2/klog.go:1026 +0xb9
Sep 15 14:14:25 staging-a-3-mks.rohea.com microk8s.daemon-kubelite[1007360]: k8s.io/kubernetes/vendor/k8s.io/klog/v2.(*loggingT).output(0x9b22e80, 0xc000000003, 0x0, 0x0, 0xc024713dc0, 0x0, 0x7f1fda1, 0x14, 0x11f, 0x0)
Sep 15 14:14:25 staging-a-3-mks.rohea.com microk8s.daemon-kubelite[1007360]:         /build/microk8s/parts/k8s-binaries/build/go/src/github.com/kubernetes/kubernetes/_output/local/go/src/k8s.io/kubernetes/vendor/k8s.io/klog/v2/klog.go:975 +0x1e5
Sep 15 14:14:25 staging-a-3-mks.rohea.com microk8s.daemon-kubelite[1007360]: k8s.io/kubernetes/vendor/k8s.io/klog/v2.(*loggingT).printf(0x9b22e80, 0x3, 0x0, 0x0, 0x0, 0x0, 0x61764b6, 0x13, 0x0, 0x0, ...)
Sep 15 14:14:25 staging-a-3-mks.rohea.com microk8s.daemon-kubelite[1007360]:         /build/microk8s/parts/k8s-binaries/build/go/src/github.com/kubernetes/kubernetes/_output/local/go/src/k8s.io/kubernetes/vendor/k8s.io/klog/v2/klog.go:753 +0x19a
Sep 15 14:14:25 staging-a-3-mks.rohea.com microk8s.daemon-kubelite[1007360]: k8s.io/kubernetes/vendor/k8s.io/klog/v2.Fatalf(...)
Sep 15 14:14:25 staging-a-3-mks.rohea.com microk8s.daemon-kubelite[1007360]:         /build/microk8s/parts/k8s-binaries/build/go/src/github.com/kubernetes/kubernetes/_output/local/go/src/k8s.io/kubernetes/vendor/k8s.io/klog/v2/klog.go:1514
Sep 15 14:14:25 staging-a-3-mks.rohea.com microk8s.daemon-kubelite[1007360]: k8s.io/kubernetes/cmd/kube-controller-manager/app.Run.func4()
Sep 15 14:14:25 staging-a-3-mks.rohea.com microk8s.daemon-kubelite[1007360]:         /build/microk8s/parts/k8s-binaries/build/go/src/github.com/kubernetes/kubernetes/_output/local/go/src/k8s.io/kubernetes/cmd/kube-controller-manager/app/controllermanager.go:287 +0x8f
Sep 15 14:14:25 staging-a-3-mks.rohea.com microk8s.daemon-kubelite[1007360]: k8s.io/kubernetes/vendor/k8s.io/client-go/tools/leaderelection.(*LeaderElector).Run.func1(0xc009579560)
Sep 15 14:14:25 staging-a-3-mks.rohea.com microk8s.daemon-kubelite[1007360]:         /build/microk8s/parts/k8s-binaries/build/go/src/github.com/kubernetes/kubernetes/_output/local/go/src/k8s.io/kubernetes/vendor/k8s.io/client-go/tools/leaderelection/leaderelection.go:203 +0x29
Raising panic and causes kubelite to restart. Since in v1.22, dqlite and kubelite are running in the same process. This forces dqlite to restart and then an endless loop.
But from v1.23, dqlite runs in a separate process, so any restart on kubelite will not force dqlite to restart. Making it more stable as far as i understand.
I was thinking of suggesting to upgrade to v1.23. but i am not sure of the implication on the datastore
@ktsakalozos, @melkamar what do you think?
Worth a try. I upgraded all three nodes one by one, but the end result is the same. Still restarts. Here is the microk8s inspect after the full cluster upgrade from the main node.
It took a few minutes for each node's upgraded version to propagate to the output of kubectl get nodes, don't know if that is relevant.
I'll try removing the nodes from the cluster and see if the single-node cluster is able to recover. If not, I'll revert to a snapshot before this started happening because we need the staging cluster operable. I have backups of the current broken state, however, so I can continue debugging this there. We are running a small part of our production workloads on a microk8s cluster and I am worried of something like this happening there, so I want to get to the bottom of how to fix the cluster.
Ok the dqlite cluster.yaml doesn't seem to see the other node.
- Address: 94.237.101.145:19001
  ID: 3297041220608546238
  Role: 0
- Address: 94.237.96.48:19001
  ID: 361013223158465256
  Role: 2
In raft there should be atleast 3 nodes to be highly available. In this case dqlite cannot function as it lost the quorum. The second node strangely becomes a standby node Role: 2.
There is this link from microk8s explaining how to recover from lost quorum.
https://microk8s.io/docs/restore-quorum
I ran that inspect after I had already removed the third node from the cluster, that's why there are two nodes listed there, my apologies for making this more confusing.
I think that would also explain why the second node here switches into a standby role, since the removal of the node was graceful (through microk8s leave and microk8s remove-node).
This issue has been automatically marked as stale because it has not had recent activity. It will be closed if no further activity occurs. Thank you for your contributions.