code.pyret.org
 code.pyret.org copied to clipboard
Published
20 hours ago •
 brownplt
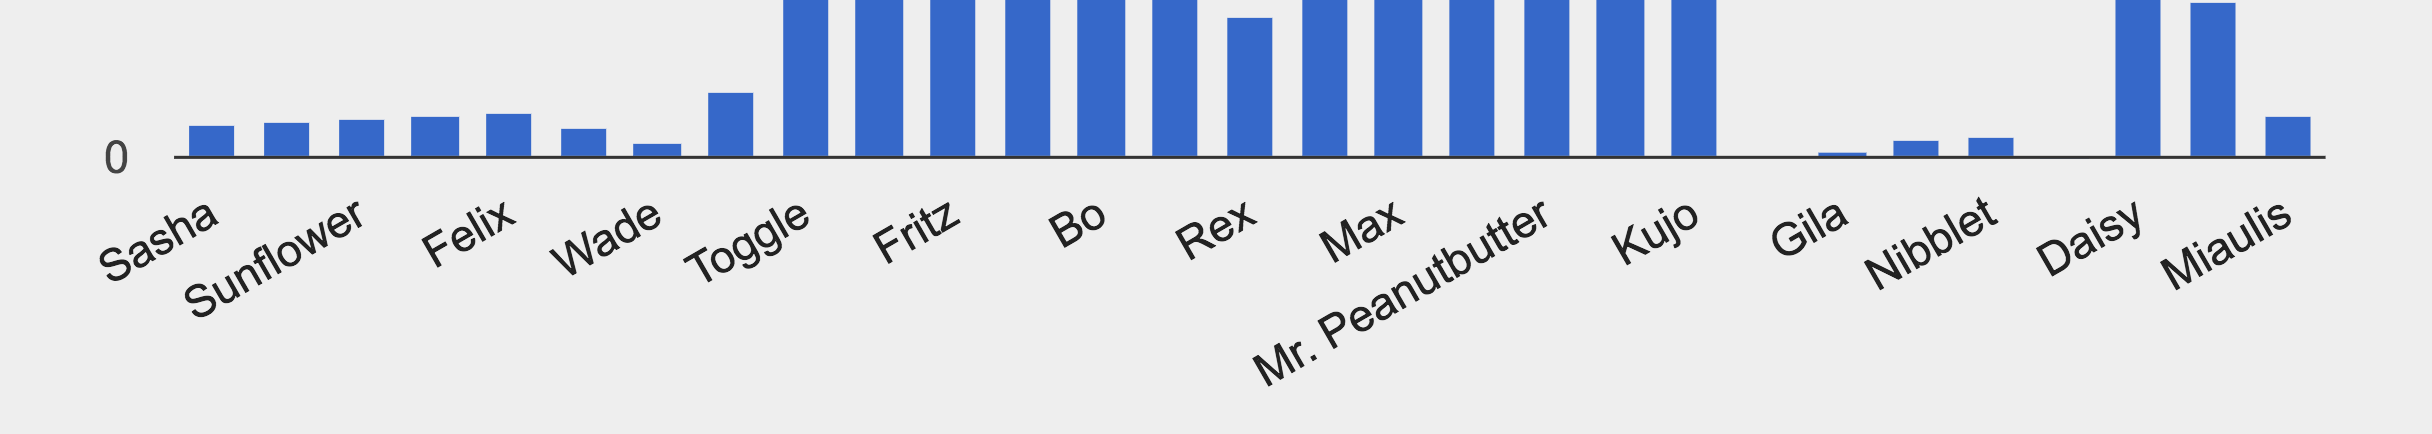
bar-chart has no way to see very small columns when labels don't show
This picture is from the standard data science data set. There are a few columns that are too small to get a pixel to hover over them so there is no way to see the label or the contents of those columns. See in between Nibblet and Daisy, for example.
include shared-gdrive("Bootstrap-DataScience-v2.arr", "0BzzMl1BJlJDkZ2NoSnFoQl91NFE")
shelter-sheet = load-spreadsheet("19m1bUCQo3fCzmSEmWMjTfnmsNIMqiByLytHE0JYtnQM")

# load the 'animals' sheet as a table
animals-table = load-table: name, species, gender, age, fixed, legs, pounds, weeks
  source: shelter-sheet.sheet-by-name("pets", true)
end
bar-chart(animals-table, "name", "pounds")
@jpolitz I tried this out using a contrived table, to see if the Google Charts library did better.
It does seem to draw a 1px line for extremely small bars, even if the label is obscured. And while these lines are a painful hover target to use, they do work. I can't think of a better behavior here.
Do you still want to keep this open?