FlameGraph
 FlameGraph copied to clipboard
Stack trace visualizer
The following stack is taken from the example file: ``` CPU ID FUNCTION:NAME 0 64091 :tick-60s genunix`segvn_fault unix`pagefault+0x96 unix`trap+0x2c7 unix`0xfffffffffb8001d6 1 ``` with `includeoffset` it renders to: ``` unix`0xfffffffffb8001d6;unix`trap+0x2c7;unix`pagefault+0x96;genunix`segvn_fault ```...

#186 introduced `stackcollapse-bpftrace`, but since then, it appears the output of `bpftrace` has changed slightly. Specifically, a trace command like ```console # bpftrace -e 'profile:hz:999 /pid == 2141/ { @[ustack]...
This just cleans up some redundant processing: Rather than parsing the input lines with the same regexps twice, store the split input in `@Data`.
On a flamegraph with a lot of information, it can be hard to see where the largest sample counts are. This PR adds an option to arrange the output image...
@brendangregg Hello, I have a question, when I use ' perf top - e cycles - p 123' will appear " The sys_perf_event_open () syscall returned with 3 (No to...
Consider this input: ``` Thread 1;foo;bar;baz 100 Thread 2;foo;baz 100 Thread 2;foo;bar;baz 100 ``` processed with `flamegraph.pl output.txt > out.svg` 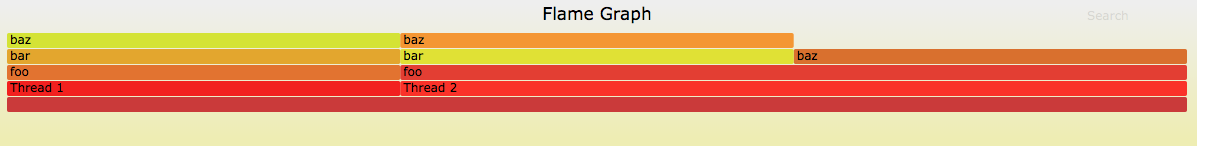 processed with `flamegraph.pl --reverse output.txt > out-rev.svg`  The...
The shebang of stackcollapse.pl begins with `#!/usr/bin/perl`. On FreeBSD, Perl is located in `/usr/local/bin`, causing the script to fail. Does anything speak against using the canonical form `#!/usr/bin/env perl`?
FlameGraph is a very nice tool. However, I noticed that within one layer, functions are ordered alphabetically. I thought it would be better to order them in the same order...
Inverted reversed icicle graphs have been quite useful. One possible refinement would be to order the top of the icicle by width or number of samples, rather than alphabetically. Then...
hi~ follow is the result of using 'perf report' ``` Samples: 16M of event 'probe_libc:malloc' Event count (approx.): 16313258 100.00% testsvr libc-2.17.so [.] malloc | --- malloc | |--41.18%-- std::_Rb_tree::_M_get_node()...