DeskGap
 DeskGap copied to clipboard
Published
20 hours ago •
 branchseer
Debugging how to
I would also like to know how to do this (Windows 10 x64 here).
I'm able to remotely debug the webview fine using Microsoft Edge Devtools Preview.
The Node side however is a black box to me.
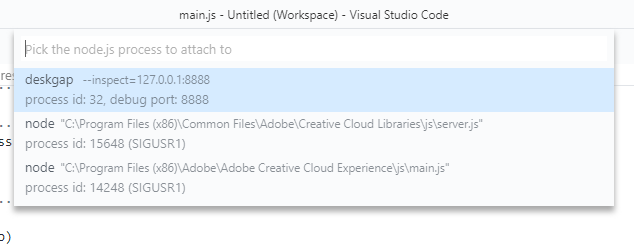
I tried running deskgap.exe --inspect=127.0.0.1:8888. When running Visual Studio Code's 'Debug: Attach to Node Process', the process appears in the list of detected processes:
But the connection fails:
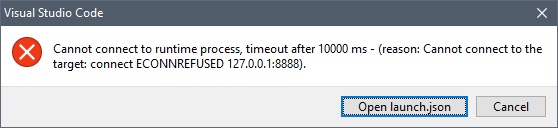
Opening localhost:8888/json in Chrome also results in the same ERR_CONNECTION_REFUSED.
Are there any tricks involved to connect a debugger to Deskgap?
@ldstein how did you manage to debug the webview? I can't seem to get it to work. The app isn't showing up in devtools.