Potential memory leak with Metal backend
Describe the bug When iteratively resizing a dynamic buffer, after reaching a certain size (around 159K vertices in my case), ram usage explodes.
To Reproduce I am not sure if this is because I am doing something wrong but I can reproduce with this code:
// Include BGFX headers
#include <vector>

void setupView(bgfx::ViewId view, uint16_t width, uint16_t height)
{
    bgfx::setViewClear(view, BGFX_CLEAR_COLOR | BGFX_CLEAR_DEPTH, 0, 1.0f, 0);
    bgfx::setViewRect(view, 0, 0, width, height);
    bgfx::setViewTransform(view, nullptr, nullptr);
}

void resizeBuffer(uint32_t size, std::vector<Vertex>& vertices, std::vector<uint32_t>& indexes)
{
    vertices.resize(size);
    indexes.resize(size);
}

void updateBufferData(std::vector<Vertex>& vertices, std::vector<uint32_t>& indexes, bgfx::DynamicVertexBufferHandle vbh, bgfx::DynamicIndexBufferHandle ibh)
{
    bgfx::update(vbh, 0, bgfx::copy(vertices.data(), vertices.size() * sizeof(Vertex)));
    bgfx::update(ibh, 0, bgfx::copy(indexes.data(), indexes.size() * sizeof(uint32_t)));
}

void setBuffersActive(uint32_t size, bgfx::DynamicVertexBufferHandle vbh, bgfx::DynamicIndexBufferHandle ibh)
{
    bgfx::setVertexBuffer(0, vbh, 0, size);
    bgfx::setIndexBuffer(ibh, 0, size);
}

int32_t main()
{
    // Create application context
    const int32_t window_width  = 1000;
    const int32_t window_height = 1000;

    // Create context
    ....

    std::vector<Vertex>   vertices;
    std::vector<uint32_t> indexes;
    bgfx::DynamicVertexBufferHandle vbh = bgfx::createDynamicVertexBuffer(uint32_t{0}, Vertex::s_layout, BGFX_BUFFER_ALLOW_RESIZE);
    bgfx::DynamicIndexBufferHandle  ibh = bgfx::createDynamicIndexBuffer(uint32_t{0}, BGFX_BUFFER_ALLOW_RESIZE | BGFX_BUFFER_INDEX32);

    bgfx::ProgramHandle program;
    // Initialize shader program
    ....

    uint32_t object_count = 53000;

    while (true)
    {
        const bgfx::ViewId view = 0;
        setupView(view, window_width, window_height);

        // Iteratively increment buffer size
        object_count += object_count < 54000 ? 1 : 0;
        const uint32_t vertex_count = 3 * object_count;

        // Update buffer data
        resizeBuffer(vertex_count, vertices, indexes);
        for (uint32_t i{0}; i<vertex_count; ++i) {
            const float range = 0.1f;
            vertices[i].position = {/* random coords in range [-1, 1] */};
            vertices[i].color    = { random color};
            indexes[i] = i;
        }
        updateBufferData(vertices, indexes, vbh, ibh);

        // Render the triangles
        setBuffersActive(vertex_count, vbh, ibh);
        bgfx::submit(view, shader.m_program);

        bgfx::frame();
    }

    // Close BGFX and free context
    ....
    return 0;
}
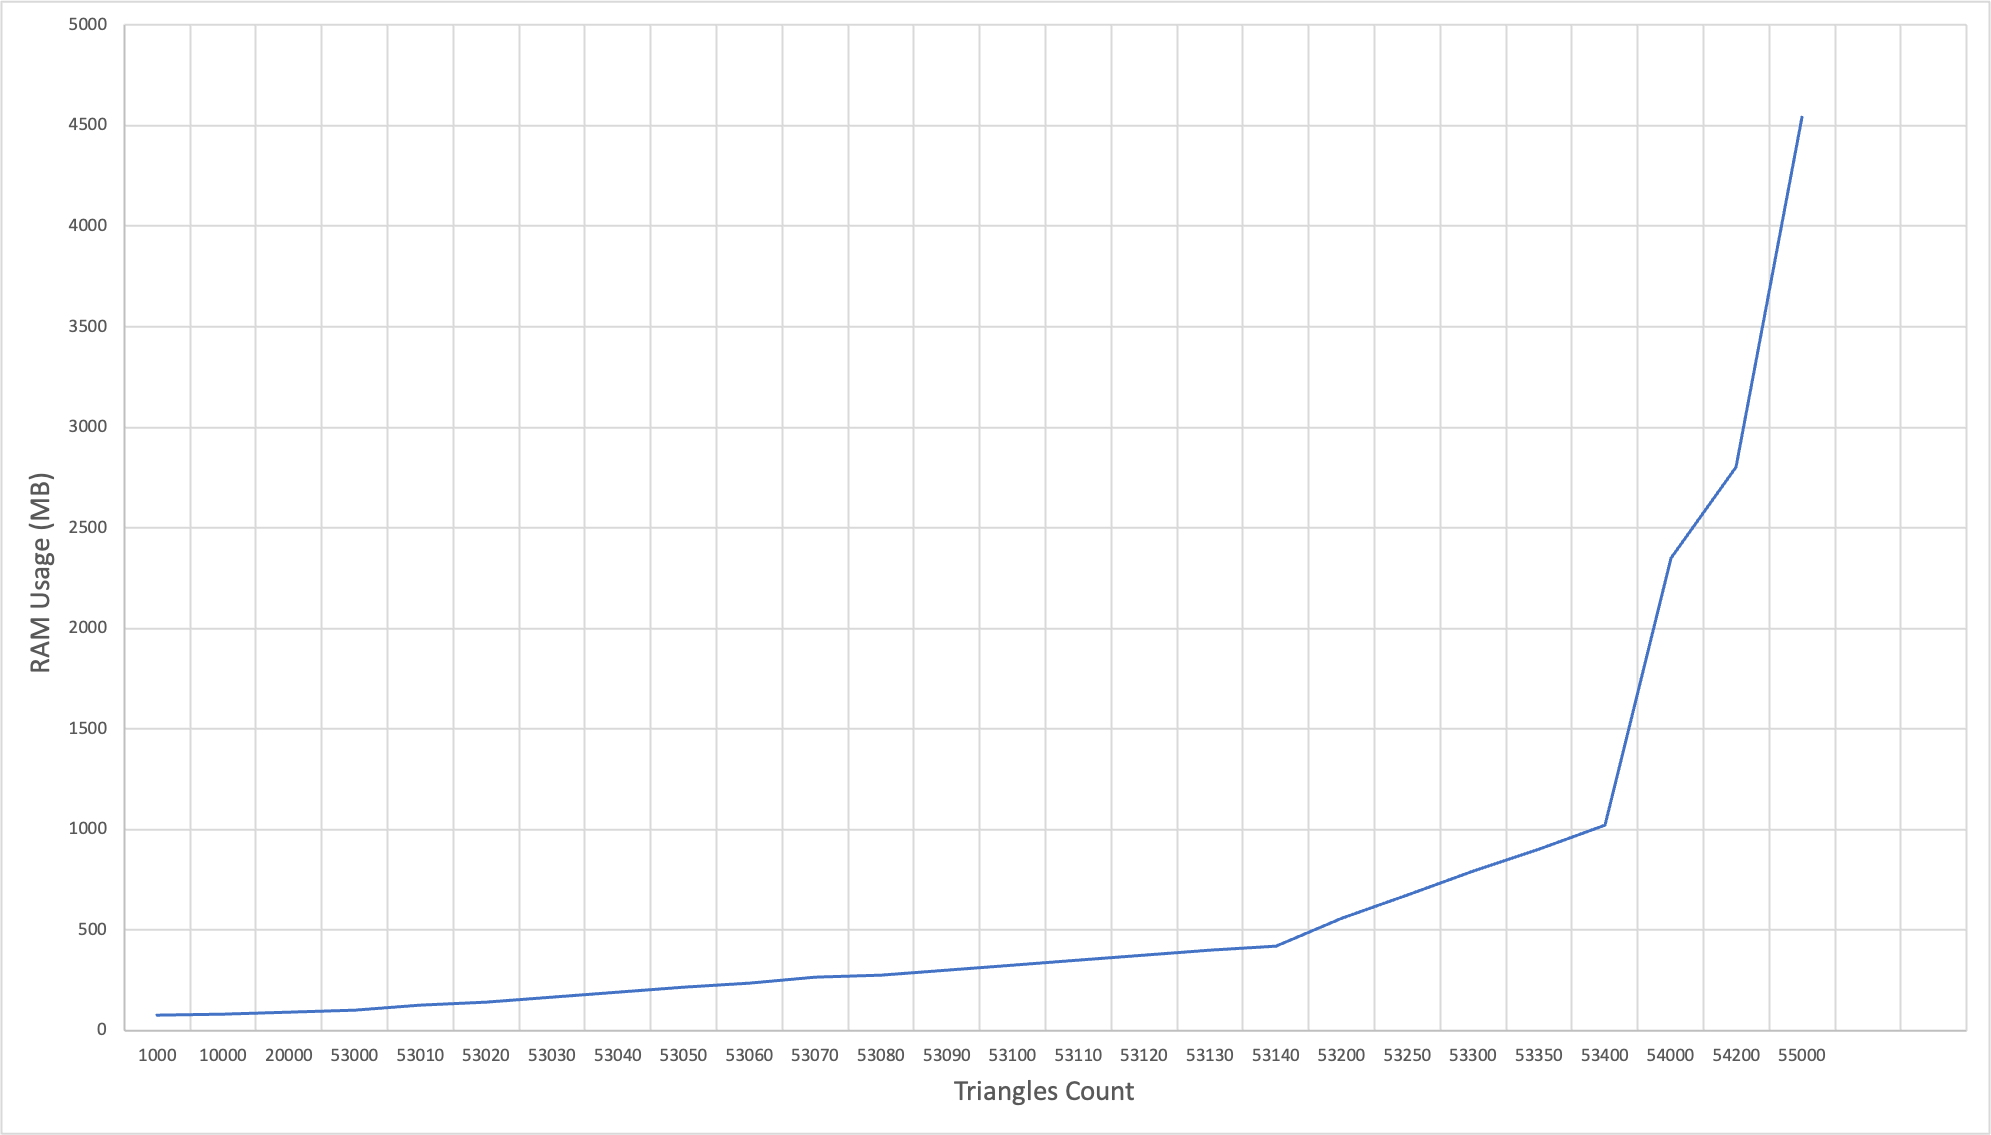
Expected behavior I would expect the ram usage to grow linearly (and slowly) with the number of vertex
Screenshots Here is a graph I made with the ram usage of the process depending on the max buffer size.
Additional context
If I directly allocate a dynamic buffer of size 55000 the ram usage is normal (around 110 MB).
I am using an M1 based mac on macOS 12.5 (Monterey).
Thank you for your help.
Can you use existing example from repo to reproduce this issue?
If you're not using build system provided, this particular issue might be due to your compiler settings...
Thank you for your response.
I did generate the xcode project using this command
../bx/tools/bin/darwin/genie --with-combined-examples --xcode=osx xcode9
Then I modified the helloworld example https://github.com/johnBuffer/bgfx/blob/memory-test/examples/00-helloworld/helloworld.cpp
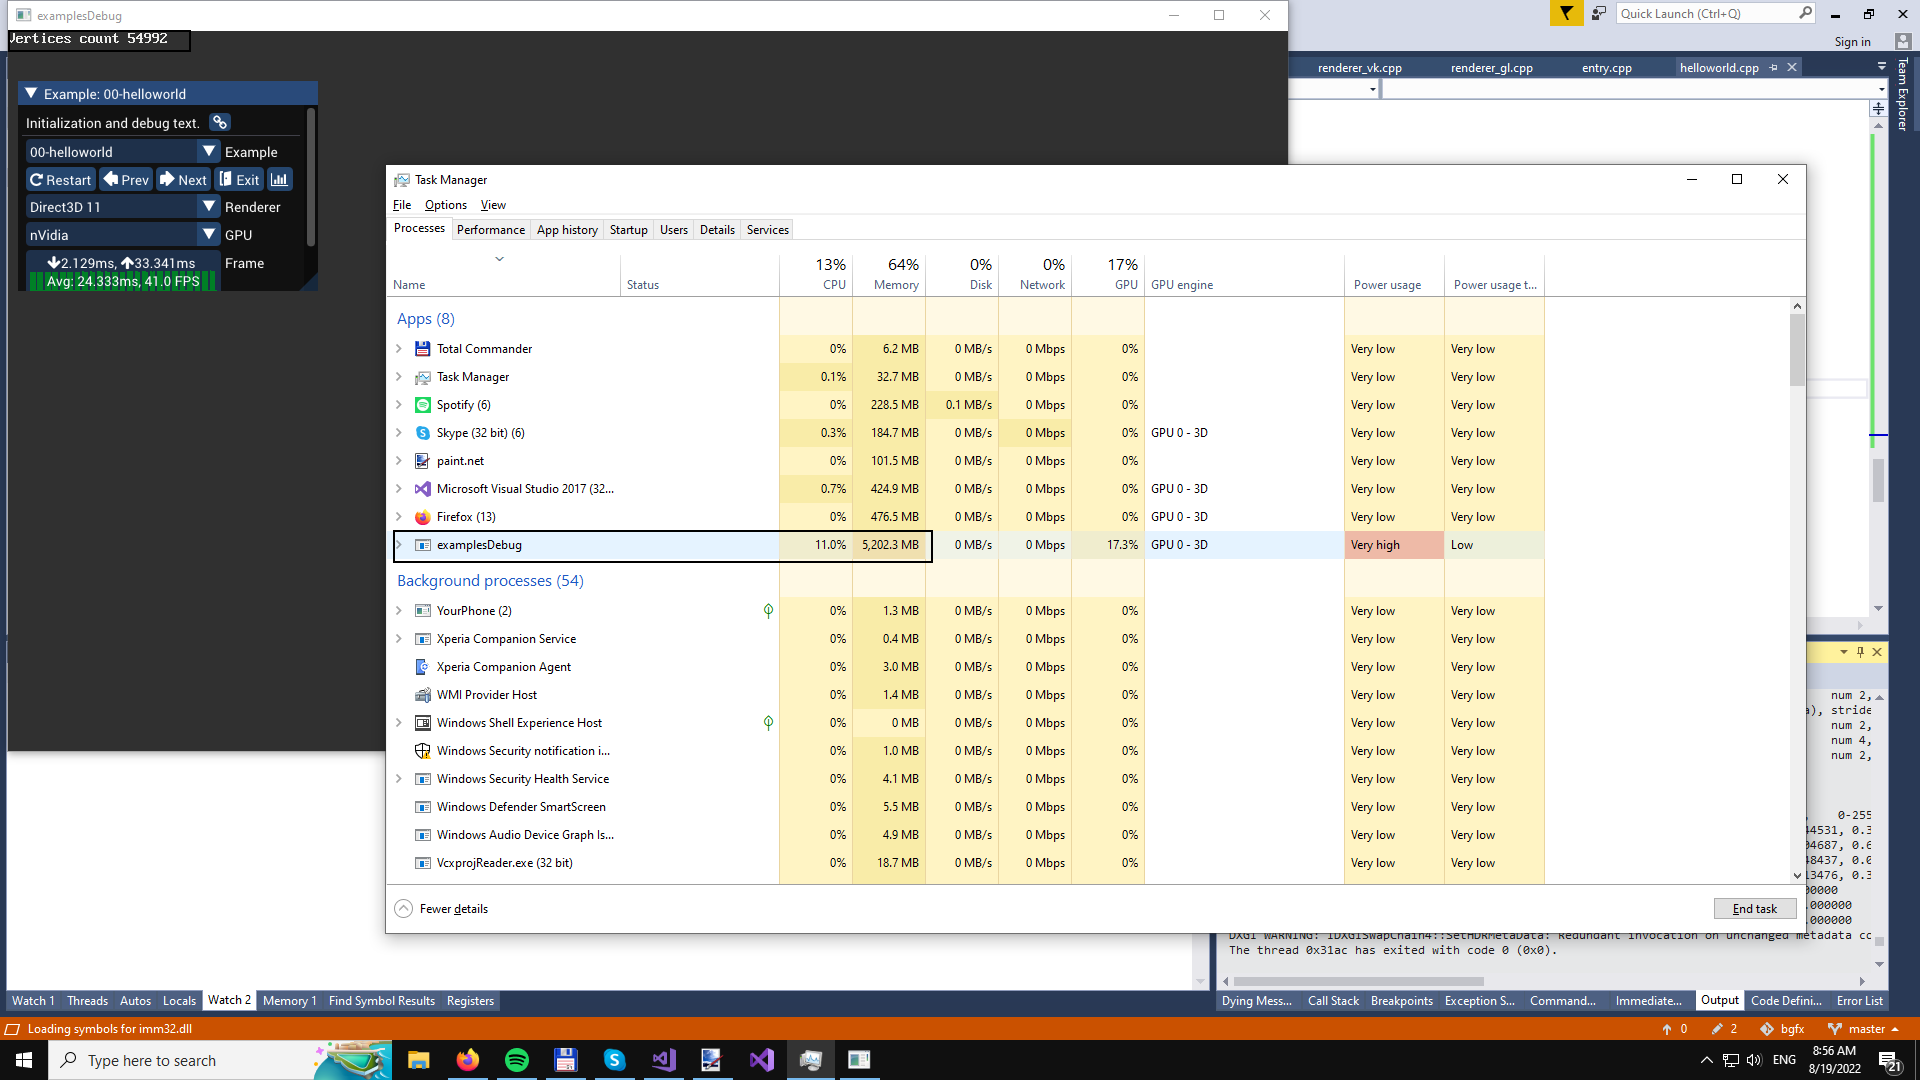
It seems that the memory usage is similar
But isn't that exactly what you expect to see? You're updating by 1 object until you reach 55k objects:
            object_count += object_count < 55000;
            const uint32_t vertex_count = 3 * object_count;
            resizeBuffer(vertex_count, vertices, indexes);
            updateBufferData(vertices, indexes, vbh, ibh);
And then in updateBufferData you're copying whole buffers:
void updateBufferData(std::vector<Vertex>& vertices, std::vector<uint32_t>& indexes, bgfx::DynamicVertexBufferHandle vbh, bgfx::DynamicIndexBufferHandle ibh)
{
    bgfx::update(vbh, 0, bgfx::copy(vertices.data(), static_cast<uint32_t>(vertices.size()) * sizeof(Vertex)));
    bgfx::update(ibh, 0, bgfx::copy(indexes.data(), static_cast<uint32_t>(indexes.size()) * sizeof(uint32_t)));
}
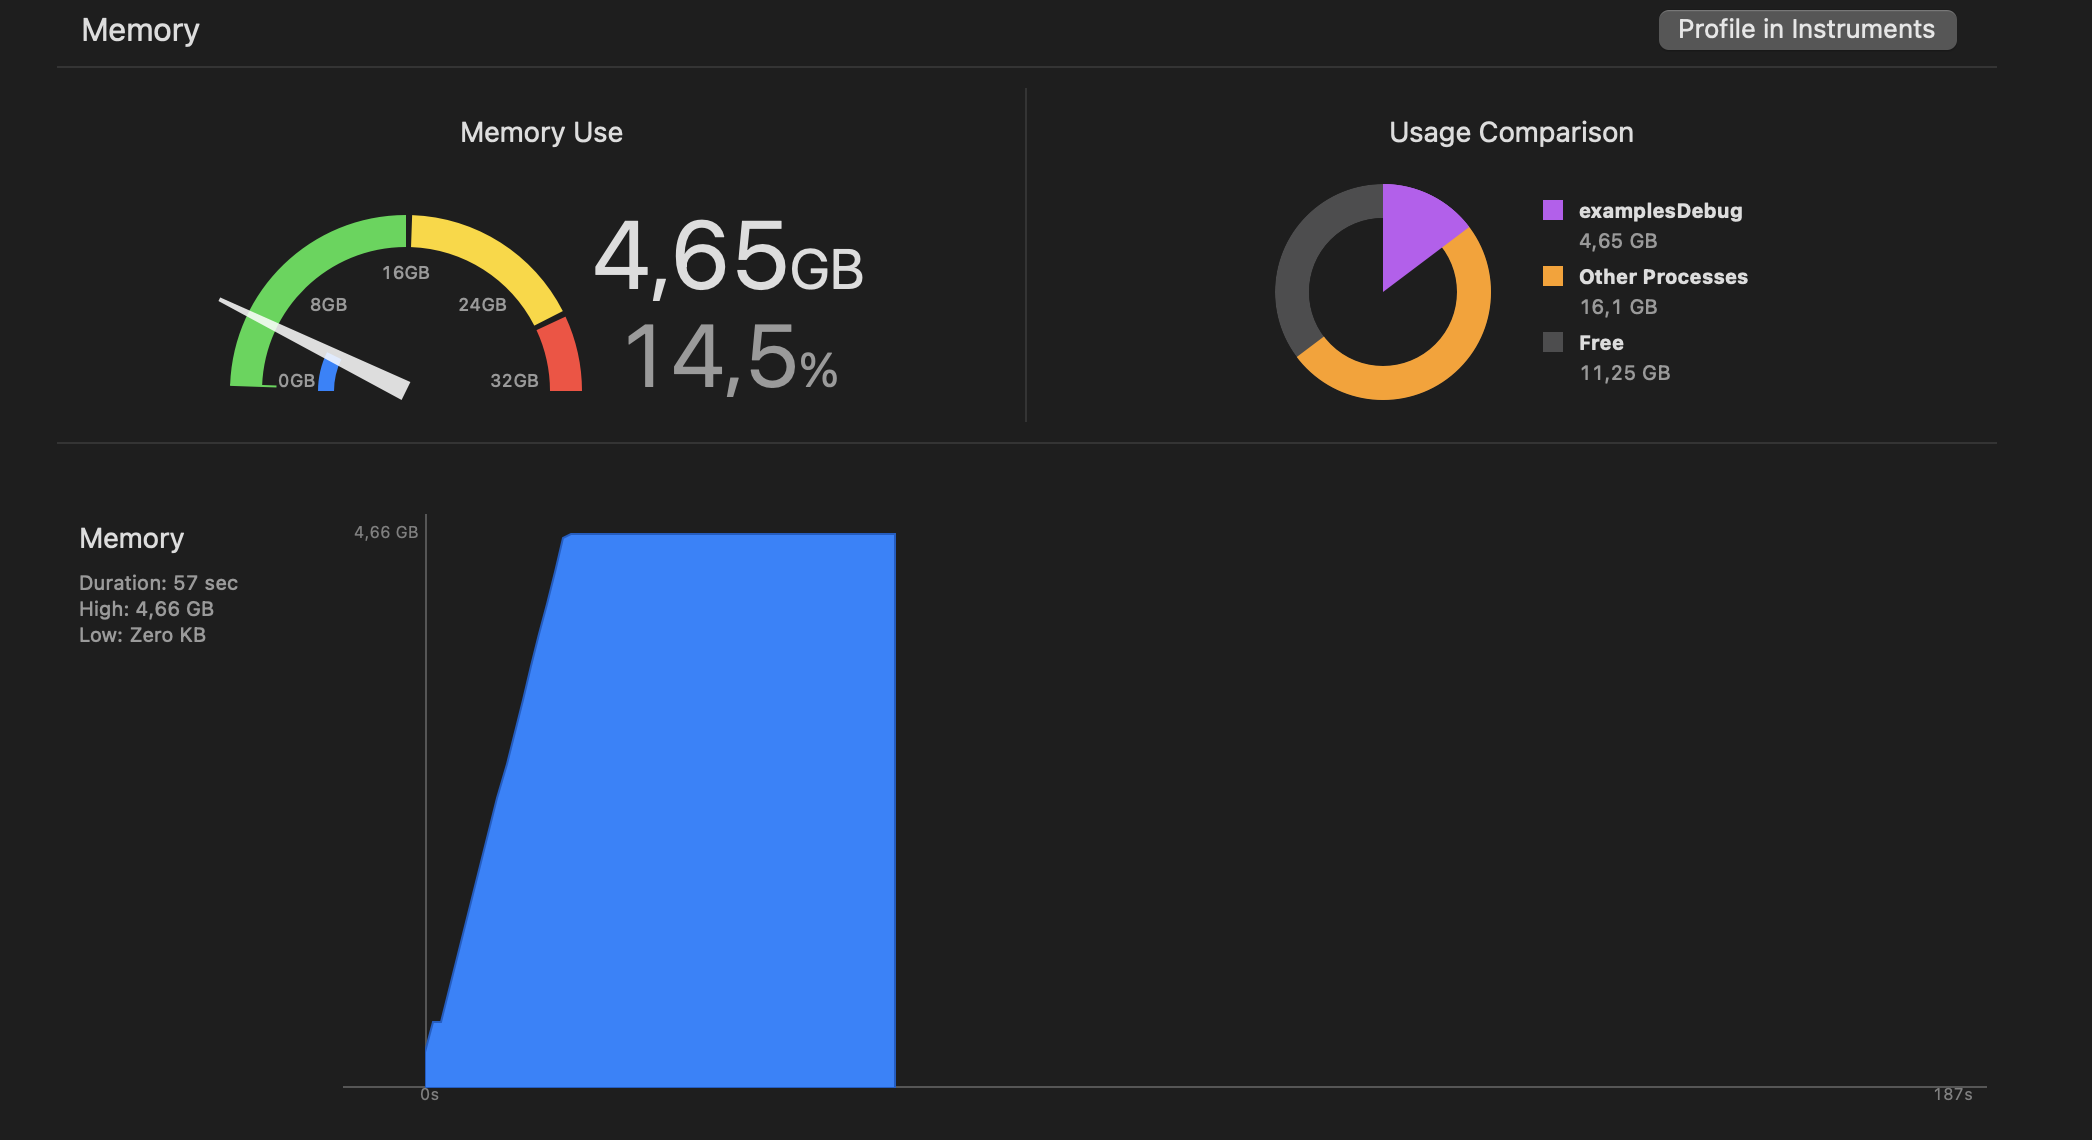
And then you stop increasing number of objects your graph peaks and stays steady at that max point. 4.65 GB sounds too much for it, but graph looks as expected to me. For leak I would expect graph to continue straight up, not to be flat at the end.
@attilaz Do you know why memory tracker is showing so much memory used on OSX?
What I find strange is that:
- the memory footprint is huge for the number of vertices
- iteratively resizing result in 4,6 GB memory usage while directly resizing to (55000 * 3) results in 120 MB, I would expect the end result to be the same in both cases
Thanks for the repro. It has a higher than expected memory usage on my intel macbook air too. BufferMtl::create is called with increasing size parameters, but no BufferMtl::destory is called when resizing.
The same happens on windows too, so I think this is not a metal renderer issue.
With the fix you made the example is now working fine on my side. However it seems the memory leak is still present if I just add a second empty dynamic vertex buffer, like so https://github.com/johnBuffer/bgfx/commit/a05268e42938bda4a869b1c896243dfefb690eba
I did a very quick investigation and it seems that this change makes this condition become false, resulting in destroyVertexBuffer(handle) not being called.
I made this fix that will alleviate the worst case scenario: https://github.com/bkaradzic/bgfx/commit/99770c9f437bf11bfc0a540b872e2b3bd189cb30 but the issue still persist, and I need to change NonLocalAllocator to deal with orphaning allocation, and detecting which are fully free, and then cleaning them up properly.
Thank you very much for your reactivity. If I can help in any way don't hesitate to ask.