charts
 charts copied to clipboard
[bitnami/redis-cluster] All nodes in redis-cluster are showing up as Master instead of Master & Slave
Name and Version
redis-cluster-7.4.6
What steps will reproduce the bug?
I have deployed a redis-cluster with 22 nodes, with 1 replica, so it should be 11 Masters and 11 Slaves, but, I am observing that all the 22 nodes are marked as Master, And, only the first 11 nodes seem to be allowing write, as a result, I have the remaining 11 nodes marked as Master and sitting idle.
Are you using any custom parameters or values?
No
What is the expected behavior?
It should have been 11 Masters with 1 replica/slave each
What do you see instead?
Instead, I observe that all 22 nodes are marked as master and 11 nodes are inserting any data
redis:6379> cluster replicas a9953242d9ed8b0977f63808b0c6a9192de71703
(empty list or set)
redis:6379> cluster replicas 5ee456acf30e0cddc054afcd619ac5e0518f73b2
(empty list or set)

redis:6379> cluster nodes
dbe3bc33e3d7788d9b8e35023e06b6c6d08c02f6 <IP-00>:6379@16379 myself,master - 0 1658793680000 17 connected
871ecf88445b744191d7a398da5ebb28278ad3d7 <IP-01>:6379@16379 master - 0 1658793681383 11 connected 14895-16383
408adb82e2075743c72f4312511ccaf0f927bc6f <IP-02>:6379@16379 master - 0 1658793676065 10 connected 13405-14894
a65495ed30c284811a973e24812f3b1c5e93cc4a <IP-03>:6379@16379 master - 0 1658793679000 8 connected 10426-11915
4d3bf45e96d252e7446bd1abd25044a255b5654f <IP-04>:6379@16379 master - 0 1658793679000 3 connected 2979-4467
7d8a8da1b05229c509a6462c7fe24ca06061fc45 <IP-05>:6379@16379 master - 0 1658793678875 5 connected 5958-7446
b157f13079a0148a60ae3f72664f52712d55eaf1 <IP-06>:6379@16379 master - 0 1658793678374 15 connected
5ee456acf30e0cddc054afcd619ac5e0518f73b2 <IP-07>:6379@16379 master - 0 1658793677000 13 connected
a9953242d9ed8b0977f63808b0c6a9192de71703 <IP-08>:6379@16379 master - 0 1658793682385 9 connected 11916-13404
e41a8df67389415f246c1477ee8014b323987e64 <IP-09>:6379@16379 master - 0 1658793678875 19 connected
8f2d906f3672b8bb2fa3e7c6e3aeef7d8f564daa <IP-10>:6379@16379 master - 0 1658793681000 4 connected 4468-5957
9af1ed4f1e63fd570d1cd6544a1880e06f9f40a8 <IP-11>:6379@16379 master - 0 1658793678000 20 connected
a226b59268e10a4144ac666875b1e683c0bf384a <IP-12>:6379@16379 master - 0 1658793678000 6 connected 7447-8936
3bd8a19c185712fee6e5af2453daae354b2d5ad7 <IP-13>:6379@16379 master - 0 1658793680379 1 connected 0-1488
aaa897b1a30693fb5d400375d9bbf1de373449a0 <IP-14>:6379@16379 master - 0 1658793678000 2 connected 1489-2978
91faa5dba6453dac4548fe3f012d0c9cef7be423 <IP-15>:6379@16379 master - 0 1658793677570 21 connected
b417227dfaf6b4f652069ca8dbc751e47c652443 <IP-16>:6379@16379 master - 0 1658793677000 16 connected
c11c8bdf335b0974695be86f79eab6238a3e23a8 <IP-17>:6379@16379 master - 0 1658793678000 18 connected
212fd0d56774d8d91411099c77286dd34412e3b4 <IP-18>:6379@16379 master - 0 1658793680078 12 connected
9b6f9db6255fa65d63fae3c85c3da40fa95c767c <IP-19>:6379@16379 master - 0 1658793677000 14 connected
56becb50192dac16a11c1e7590fab3a1ac5d5f31 <IP-20>:6379@16379 master - 0 1658793677000 7 connected 8937-10425
75563c1111a9d9e2d19b21600299db74632960fa <IP-21>:6379@16379 master - 0 1658793678574 22 connected
@fmulero
Can you please update on the issue above, in my cluster facing same issue, all slave showing as master instead of master and slave
Waiting for above issue, please let me know how to replicate and bring back the cluster.
Thanks
Sorry for my very late response.
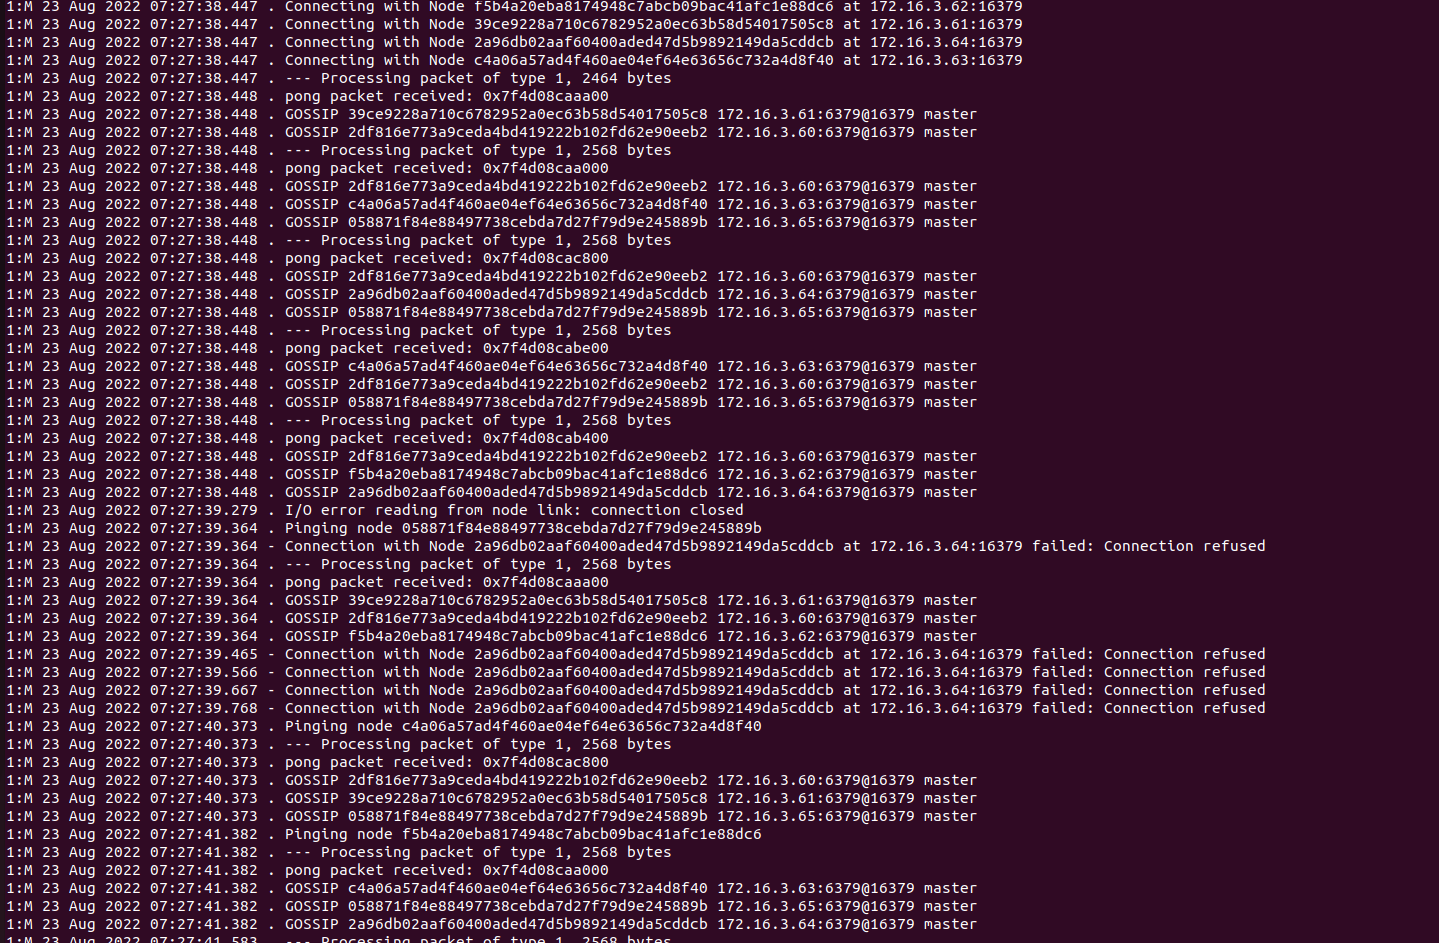
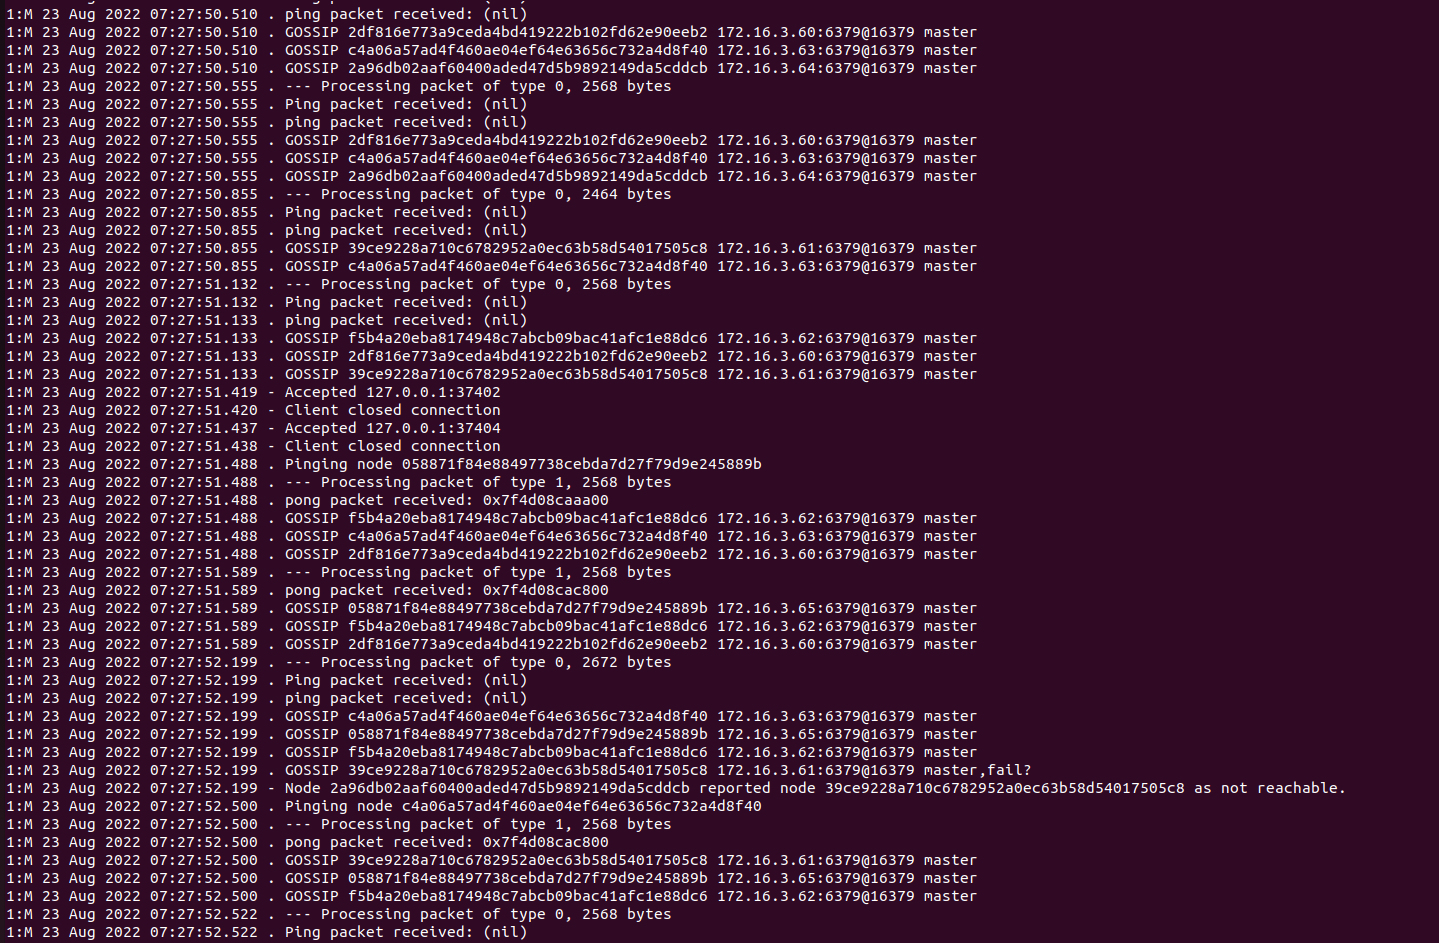
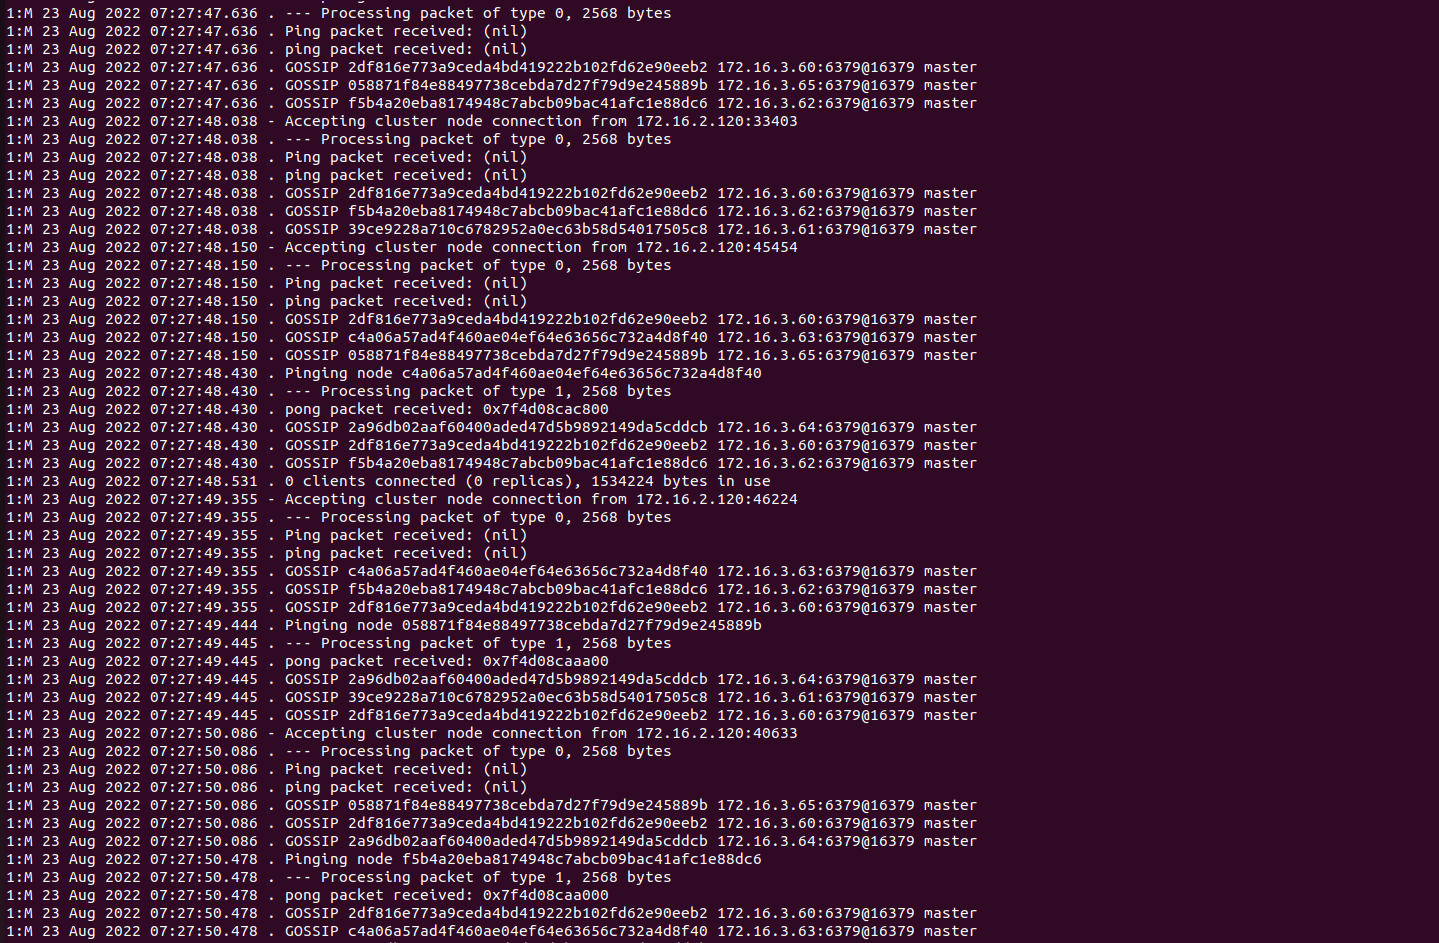
Did you see any error in the pod logs during startup? Could you share the logs from some of the pods (not all are needed)? I think it could be a network or name resolution issue. Could you run this in one of the pods (please replace <RELEASE_NAME> with your release name)?
cat < /dev/null > /dev/tcp/<RELEASE_NAME>-redis-cluster-0.rc-redis-cluster-headless/6379 && echo 'It works' || echo 'It does not work'
Apologies for the delay, here are the logs
2022-08-12T20:35:30.078 [Error] Executed 'Functions.atfs_rcache_patcrypt' (Failed, Id=e311a4eb-e2c5-42a7-a6d8-5ec2e00503d4, Duration=4ms)Result: FailureException: ServiceRequestError: <urllib3.connection.HTTPSConnection object at 0x7f06449018b0>: Failed to establish a new connection: [Errno -2] Name or service not knownStack:   File "/azure-functions-host/workers/python/3.9/LINUX/X64/azure_functions_worker/dispatcher.py", line 314, in _handle__function_load_requestfunc = loader.load_function(File "/azure-functions-host/workers/python/3.9/LINUX/X64/azure_functions_worker/utils/wrappers.py", line 40, in callreturn func(*args, **kwargs)File "/azure-functions-host/workers/python/3.9/LINUX/X64/azure_functions_worker/loader.py", line 85, in load_functionmod = importlib.import_module(fullmodname)File "/usr/local/lib/python3.9/importlib/__init__.py", line 127, in import_modulereturn _bootstrap._gcd_import(name[level:], package, level)File "<frozen importlib._bootstrap>", line 1030, in _gcd_importFile "<frozen importlib._bootstrap>", line 1007, in _find_and_loadFile "<frozen importlib._bootstrap>", line 986, in _find_and_load_unlockedFile "<frozen importlib._bootstrap>", line 680, in _load_unlockedFile "<frozen importlib._bootstrap_external>", line 850, in exec_moduleFile "<frozen importlib._bootstrap>", line 228, in _call_with_frames_removedFile "/home/site/wwwroot/atfs_rcache_patcrypt/__init__.py", line 10, in <module>from utills_test import *File "/home/site/wwwroot/utills_test.py", line 52, in <module>FEATURE_STORE_URL = getSecretValue("snowflake-azfunction-fstore-dev-IP")File "/home/site/wwwroot/utills_test.py", line 39, in getSecretValueretrieved_secret = client.get_secret(secretName)File "/home/site/wwwroot/.python_packages/lib/site-packages/azure/core/tracing/decorator.py", line 78, in wrapper_use_tracerreturn func(*args, **kwargs)File "/home/site/wwwroot/.python_packages/lib/site-packages/azure/keyvault/secrets/_client.py", line 68, in get_secretbundle = self._client.get_secret(File "/home/site/wwwroot/.python_packages/lib/site-packages/azure/keyvault/secrets/_generated/_operations_mixin.py", line 1574, in get_secretreturn mixin_instance.get_secret(vault_base_url, secret_name, secret_version, **kwargs)File "/home/site/wwwroot/.python_packages/lib/site-packages/azure/core/tracing/decorator.py", line 78, in wrapper_use_tracerreturn func(*args, **kwargs)File "/home/site/wwwroot/.python_packages/lib/site-packages/azure/keyvault/secrets/_generated/v7_3/operations/_key_vault_client_operations.py", line 694, in get_secretpipeline_response = self._client._pipeline.run(  # pylint: disable=protected-accessFile "/home/site/wwwroot/.python_packages/lib/site-packages/azure/core/pipeline/_base.py", line 211, in runreturn first_node.send(pipeline_request)  # type: ignoreFile "/home/site/wwwroot/.python_packages/lib/site-packages/azure/core/pipeline/_base.py", line 71, in sendresponse = self.next.send(request)File "/home/site/wwwroot/.python_packages/lib/site-packages/azure/core/pipeline/_base.py", line 71, in sendresponse = self.next.send(request)File "/home/site/wwwroot/.python_packages/lib/site-packages/azure/core/pipeline/_base.py", line 71, in sendresponse = self.next.send(request)[Previous line repeated 2 more times]File "/home/site/wwwroot/.python_packages/lib/site-packages/azure/core/pipeline/policies/_redirect.py", line 158, in sendresponse = self.next.send(request)File "/home/site/wwwroot/.python_packages/lib/site-packages/azure/core/pipeline/policies/_retry.py", line 468, in sendraise errFile "/home/site/wwwroot/.python_packages/lib/site-packages/azure/core/pipeline/policies/_retry.py", line 446, in sendresponse = self.next.send(request)File "/home/site/wwwroot/.python_packages/lib/site-packages/azure/core/pipeline/policies/_authentication.py", line 119, in sendresponse = self.next.send(request)File "/home/site/wwwroot/.python_packages/lib/site-packages/azure/core/pipeline/_base.py", line 71, in sendresponse = self.next.send(request)File "/home/site/wwwroot/.python_packages/lib/site-packages/azure/core/pipeline/_base.py", line 71, in sendresponse = self.next.send(request)File "/home/site/wwwroot/.python_packages/lib/site-packages/azure/core/pipeline/_base.py", line 71, in sendresponse = self.next.send(request)[Previous line repeated 1 more time]File "/home/site/wwwroot/.python_packages/lib/site-packages/azure/core/pipeline/_base.py", line 103, in sendself._sender.send(request.http_request, **request.context.options),File "/home/site/wwwroot/.python_packages/lib/site-packages/azure/core/pipeline/transport/_requests_basic.py", line 361, in sendraise error
2022-08-12T20:35:40.132 [Error] Timeout value of 00:25:00 exceeded by function 'Functions.test_func2' (Id: 'c3c42918-2bac-4220-88fe-5e1011e50943'). Initiating cancellation.2022-08-12T20:35:40.207 [Error] Executed 'Functions.test_func2' (Failed, Id=c3c42918-2bac-4220-88fe-5e1011e50943, Duration=1500166ms)Timeout value of 00:25:00 was exceeded by function: Functions.test_func22022-08-12T20:35:40.067 [Error] Timeout value of 00:25:00 exceeded by function 'Functions.test_func2' (Id: 'c3c42918-2bac-4220-88fe-5e1011e50943'). Initiating cancellation.2022-08-12T20:35:40.185 [Error] Executed 'Functions.test_func2' (Failed, Id=c3c42918-2bac-4220-88fe-5e1011e50943, Duration=1500166ms)Timeout value of 00:25:00 was exceeded by function: Functions.test_func2
I have no name!@prod-redis-030-redis-cluster-12:/$ cat < /dev/null > /dev/tcp/prod-redis-030-redis-cluster-headless/6379 && echo 'It works' || echo 'It does not work'
It works
cat < /dev/null > /dev/tcp/redis-cluster-redis-cluster-0.rc-redis-cluster-headless/6379 && echo 'It works' || echo 'It does not work'

i am facing the same issue and this is the output of the above command. can you pls explain what is the probelm and how it can be solved @fmulero
@Shujja1746 @ghMinDO were you able to find the solution. if yes , please give the details.
@fmulero, is it recommended to have 22 nodes with 1 master and 1 salve for redis cluster in production,
We dont have many clients and in order to save cost, i am going with 1 master and 1 salve with 22 nodes architecture with bitnami/redis-cluster
in-memory on each pod : 100GI maxmomory: 150Gi for each pod Totalsystem memory: 2TB size of aks node: 2TB no of nodes on aks nodepool: 1 zone of aks nodepool: No zone
I see now salves are not showing up, can you please confirm on this, is it recommended for 1 master and 1 salve for such huge clusters in prod or should i change it to 1 master and 2 slave architecture.
Troublshooting for the above issue
For the current cluster with 22 nodes when i change nodepool from 1 node to 3 nodes its not coming/running
For new deployments with 22 nodes Deploying on aks Standard-128 nodepool, each node size with 2000Gi
Parameters nodes: 22 Replica: 1 type: LoadBalancer storageClass: "premium" size: 500Gi
aks nodepool with no zone and 1 node all redis nodes reflecting as master aks nodepool with 1 zone and 1 node all redis nodes reflecting as master aks nodepool with 2 zone and 2 nodes all redis nodes reflecting as master aks nodepool with 3 zone and three nodes all redis nodes are reflecting as master and slave for first deployment and for other two cluster deployments showed the same as master instead of master and slave
10.3.2.157:6379> cluster nodes 7d0b3ead5499803c45a658f907cc90488c1a788b 10.3.1.123:6379@16379 myself,master - 0 1661305767000 5 connected 5958-7446 a5d0455b24a7e089912d62ea8a3daa0d3ce93a61 10.3.1.137:6379@16379 master - 0 1661305764000 9 connected 11916-13404 a916c3240403b43ab4d092d8862626c039b563a5 10.3.2.46:6379@16379 master - 0 1661305767000 16 connected ae51511650693df415b333fb1214f60aa89bbebe 10.3.1.141:6379@16379 master - 0 1661305766000 20 connected 206b816d9f846392abdbcf905e2e7486b4583902 10.3.2.35:6379@16379 master - 0 1661305765122 6 connected 7447-8936 5807028820df4963dedd5336a3c2bb41aeadf8eb 10.3.1.130:6379@16379 master - 0 1661305769539 3 connected 2979-4467 5361d3c5e2f1f83b8c6ffbee3f9ddb7bbc381f97 10.3.2.150:6379@16379 master - 0 1661305766027 1 connected 0-1488 0737c4fc4fa77f4a85769e8c4013805e2ce2d4bc 10.3.1.110:6379@16379 master - 0 1661305765526 14 connected c6ed30fbf4451ace9374439c684c774c03af1507 10.3.2.37:6379@16379 master - 0 1661305765000 8 connected 10426-11915 6d925e465b0cfa5adc7df9e058c12d3ee39ebcbe 10.3.1.23:6379@16379 master - 0 1661305766000 2 connected 1489-2978 db59849efd51a23b8f13c3ec80631e666214f3ee 10.3.1.59:6379@16379 master - 0 1661305764000 18 connected 67ece2fd0157dbc8950859fae90dd34ab9f581e3 10.3.2.42:6379@16379 master - 0 1661305765000 15 connected c6353c02ed0c144ea82dc651fae962598ab008b7 10.3.1.128:6379@16379 master - 0 1661305769000 22 connected a3596912b6ee0b49d3549aeb01f9a31a8a512733 10.3.1.25:6379@16379 master - 0 1661305769138 11 connected 14895-16383 66964c430ae35b8a5cb5dd26576239f87c4cdd56 10.3.1.113:6379@16379 master - 0 1661305767000 7 connected 8937-10425 cfa3312b19b6d7c63eb0a8cf16c6a8b586e2d9de 10.3.1.133:6379@16379 master - 0 1661305765526 13 connected 5a50f474812b01e213bbfb9c6693f0ef0c5e1d6d 10.3.1.129:6379@16379 master - 0 1661305767132 17 connected 1c8ec604596f4b03bcdc70213233fc4d26405662 10.3.1.20:6379@16379 master - 0 1661305763116 19 connected d8f7bb97351ba48fffc4b328b716a2ab17b737a8 10.3.1.143:6379@16379 master - 0 1661305768135 10 connected 13405-14894 752af9bf0104085a7fb860128b2c8c9145476d18 10.3.1.29:6379@16379 master - 0 1661305764621 4 connected 4468-5957 acdb543b6a9843115d86fde80188ecd98da075a2 10.3.2.48:6379@16379 master - 0 1661305769037 21 connected 9f8890f4d2cf9445b1625deabd505890bf6dc1fe 10.3.2.36:6379@16379 master - 0 1661305767000 12 connected
To be honest I not able to reproduce this issue, my initial suspect is a networking problem, but any clue is welcome.
when I deploy 22 nodes redis-cluster, all nodes showing as master.
To reproduce, please deploy 22 nodes redis cluster with 1 replica each. Deploy it to AKS with nodepool size M128 --count 1 --zone 1 (showing always all nodes as master)
For nodepool count 3 and zone 1 2 3 (its showing master and slave for sometime and with some deployment its showing all master)
I've reproduce the issue. I think is related with liveness/readiness probes, Are all of your pods restarted during helm install because they are not passing the liveness check? Due to the number of nodes the initial health checks needs to be delayed a little bit more (at least in my case) Could you try increasing redis.livenessProbe.initialDelaySeconds and redis.readinessProbe.initialDelaySeconds. For instance:
$ helm install rc bitnami/redis-cluster --set cluster.nodes=22 --set cluster.replicas=1 --set redis.livenessProbe.initialDelaySeconds=15 --set redis.readinessProbe.initialDelaySeconds=15
@fmulero
I have change below and deployed 12 nodes cluster with 1 master and 2 slalve each
livenessProbe: enabled: true initialDelaySeconds: 15 periodSeconds: 5 timeoutSeconds: 5 successThreshold: 1 failureThreshold: 5
readinessProbe: enabled: true initialDelaySeconds: 15 periodSeconds: 5 timeoutSeconds: 1 successThreshold: 1 failureThreshold: 5
Still all nodes showing as master
cluster nodes
f65e3d50661e7601aac22795a5a982fc36ea912e 10.3.2.198:6379@16379 master - 0 1662068138000 10 connected 69c40b1c62bdad21925f8fbac9cb9cc0ccd9c549 10.3.2.216:6379@16379 master - 0 1662068137000 5 connected b62c34fb9504dbafd54258bef543d5068683be76 10.3.0.42:6379@16379 master - 0 1662068135507 8 connected 98b30db3ee88d0c419292e811200709b8dfe48f8 10.3.0.155:6379@16379 myself,master - 0 1662068135000 9 connected 3773d74f52289e1d6535f8aefda2dafb369d7424 10.3.0.40:6379@16379 master - 0 1662068139515 6 connected a60547d24e9075c9e331abdb7af8ecd1cad850b0 10.3.0.68:6379@16379 master - 0 1662068139014 11 connected 0d51a1a8d69266da85d7ab95c5f151205b526226 10.3.2.234:6379@16379 master - 0 1662068134504 7 connected 053e91bafb0c1ae7f4ae319a7d1740ecc94b162d 10.3.0.144:6379@16379 master - 0 1662068136000 4 connected 12288-16383 83316700dc927404ed63cd4bf3c264248e842c0c 10.3.2.211:6379@16379 master - 0 1662068137511 12 connected c58a0fc5741534ad3f8d69a201954cf4dc4245ed 10.3.0.138:6379@16379 master - 0 1662068138513 1 connected 0-4095 55c3bea1680cf750d11b85671d0f06d49df5201b 10.3.0.147:6379@16379 master - 0 1662068137000 3 connected 8192-12287 4c002b20b0ce1799aa1ed662f7f8c2d482bed38c 10.3.2.218:6379@16379 master - 0 1662068137000 2 connected 4096-8191
do we need to change periodSeconds too?
If you describe your pods you should see something like this:
Events:
  Type     Reason            Age                    From               Message
  ----     ------            ----                   ----               -------
  Warning  FailedScheduling  3m8s                   default-scheduler  0/1 nodes are available: 1 pod has unbound immediate PersistentVolumeClaims. preemption: 0/1 nodes are available: 1 Preemption is not helpful for scheduling.
  Warning  FailedScheduling  3m7s                   default-scheduler  0/1 nodes are available: 1 pod has unbound immediate PersistentVolumeClaims. preemption: 0/1 nodes are available: 1 Preemption is not helpful for scheduling.
  Normal   Scheduled         3m4s                   default-scheduler  Successfully assigned default/rc-redis-cluster-4 to docker-desktop
  Normal   Killing           2m29s                  kubelet            Container rc-redis-cluster failed liveness probe, will be restarted
You should adjust initialDelaySeconds and probably periodSeconds to avoid killing it during first initialization
This Issue has been automatically marked as "stale" because it has not had recent activity (for 15 days). It will be closed if no further activity occurs. Thanks for the feedback.
Due to the lack of activity in the last 5 days since it was marked as "stale", we proceed to close this Issue. Do not hesitate to reopen it later if necessary.