bisq
 bisq copied to clipboard
High system load on Arch linux
Description
One of my two always-on bisq apps is sitting at 100% CPU.
Version
1.2.7
Steps to reproduce
nothing special. start it up.
Expected behaviour
not have that high of a CPU load
Actual behaviour
Profiling the thing shows: 33.4% - bisq.common.storage.FileManager.saveToFile 21.7% - bisq.network.http.HttpClient.requestWithGETProxy 9.5% - com.google.protobuf.GeneratedMessageV3.parseDelimitedWithIOException
Screenshots
Device or machine
my dev machine, arch linux
I believe the biggest bottleneck in saveToFile (at least from what I've seen using sampling mode in JProfiler) is the FileDescriptor::sync call to try to force a write to disc, rather than protobuf conversion during persistence. I'm not sure if that's actual CPU usage though.
I just found that Bisq writes 2GB of data to disk in just 2h of uptime.
I strongly recommend deciding on https://github.com/bisq-network/projects/issues/25 just to address this before it becomes an issue.
CPU load is WAY too high for this application. Does this issue only affect arch linux, and not all platforms?
just stumbled over that again and took the chance to take another snapshot:
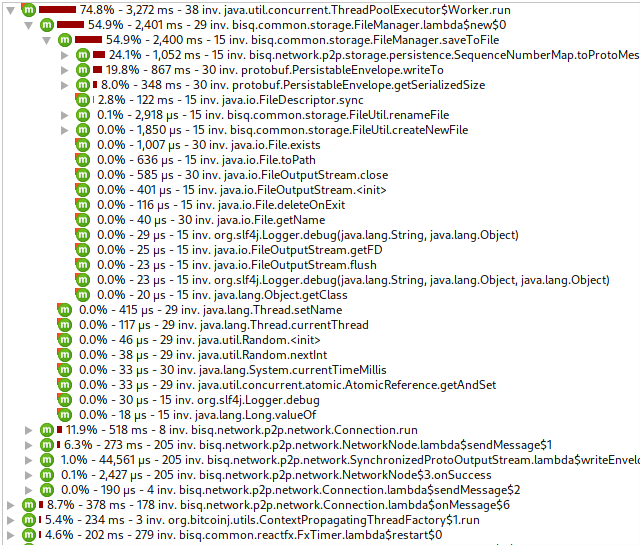
this snapshot was taken 20 minutes after the dao sync process received its last block.
@tenaciousRas after some investigating, I believe that is not only for arch linux but a general issue. However, I do have no means to verify that...
@freimair Sweet snapshot - same here I cannot verify on Windows or Mac. My question is somewhat rhetorical - it probably isn't confined to *nix. Could be related to #3752. I haven't checked out the code, yet. Talk of thread-safe serialization within a FileManager class doesn't sound proper. "Create protobuf objects on the UserThread instead of the FileManager writer thread" --- sounds proper to me and points to something lacking in architecture.
@stejbac what is your take on this? could your fix on #3752 enabled this/let this shine through/already fixed it?
stejbac:
I don't think #4025 would affect the hotspot in the screenshot, as it makes no important change to the way SequenceNumberMap is serialised from FileManager. I think that class (like a number of others implementing PersistableEnvelope) already had thread-safe proto conversion, as it just had a single ConcurrentHashMap field. So I didn't force it to run in the user thread. The majority of classes implementing PersistableEnvelope were made to do proto conversion (during persistence) in the user thread, but I'm fairly sure that wouldn't help performance - it might make it harder to spot in the JProfiler views though. It looks like the JProfiler run in the screenshot was in full instrumentation mode - I'm not sure it that might be affecting the apparent hotspot at all, but when I profiled the same area of the code in sampling mode the hotspot seemed to be coming from the sync method call rather than proto conversion.
No update in many years?
I found this issue after struggling with bisq draining some resource on my system during bisq startup. The mouse cursor or keyboard input works at 2 events per second for some 2 minutes straight when bisq is starting up. And that is on a 24 core, 32GB RAM desktop with SSD. I also notice CPU load to go be high during that time but I'm surprised the app manages to kill performance outside of the app itself.
So while writing this reply, I saw weird lines flicker on my screen outside the bisq window. this is indeed a bit scary.
Does this issue not affect others?
Ok, I have a lead. I have a 2 monitor setup with one in portrait orientation and when I minimize the bisq window, my system turns smooth. When I bring back the window, it laaaggs everything to the point that typing produces double letters and missing shift modifiers.
Screencast from 2024-05-07 19-26-33.webm
Funny how it even appears to mess with my screen recording :D
@Giszmo just a hunch, but would you be able to confirm if bisq is using HW acceleration or not? If not, that could be the cause of poor performance within the app, though not sure it would affect the entire system.
You can launch the app with -Dprism.verbose=true. If HW acceleration is not being used, it may print something like the following:
Failed Graphics Hardware Qualifier check.
System GPU doesn't meet the es2 pipe requirement
GraphicsPipeline.createPipeline: error initializing pipeline com.sun.prism.es2.ES2Pipeline
*** Fallback to Prism SW pipeline
 vsync: true vpipe: false
You can follow similar instructions at the bottom of https://bisq.wiki/Reducing_memory_usage by adding it to your Bisq.cfg.
So can we agree that it's a severe bug that the app needs hardware acceleration to show a window with a spinner? When I minimize the window, it should do the same as maximized except for the UI, yet the bigger I draw the window the more my mouse cursor lags.
It probably does not use hardware acceleration if that's GPU you are talking about as I have issues configuring it.
The UI framework (JavaFx) determines whether to enable HW acceleration based on your system, and in some cases may disable it and fall back to SW acceleration. Some of the UI components used require heavy processing and will increase CPU usage if using SW acceleration. As to whether that heavy processing is due to an issue with Bisq's implementation or the framework itself, is a separate discussion. But I believe there is an option within the Bisq app to disable animations, which might help. Or if you do have a GPU available, you can try forcing it to use HW acceleration with -Dprism.forceGPU=true.
I have a monster machine with way more CPU/RAM than necessary to show a screen with a spinner smoothly.
To test your hypothesis that javafx is the culprit, I ran pacman-javafx-3d with no impact to the rest of the system: