Bar Plot shows legend for values not included in plot
- [ ] What's wrong?
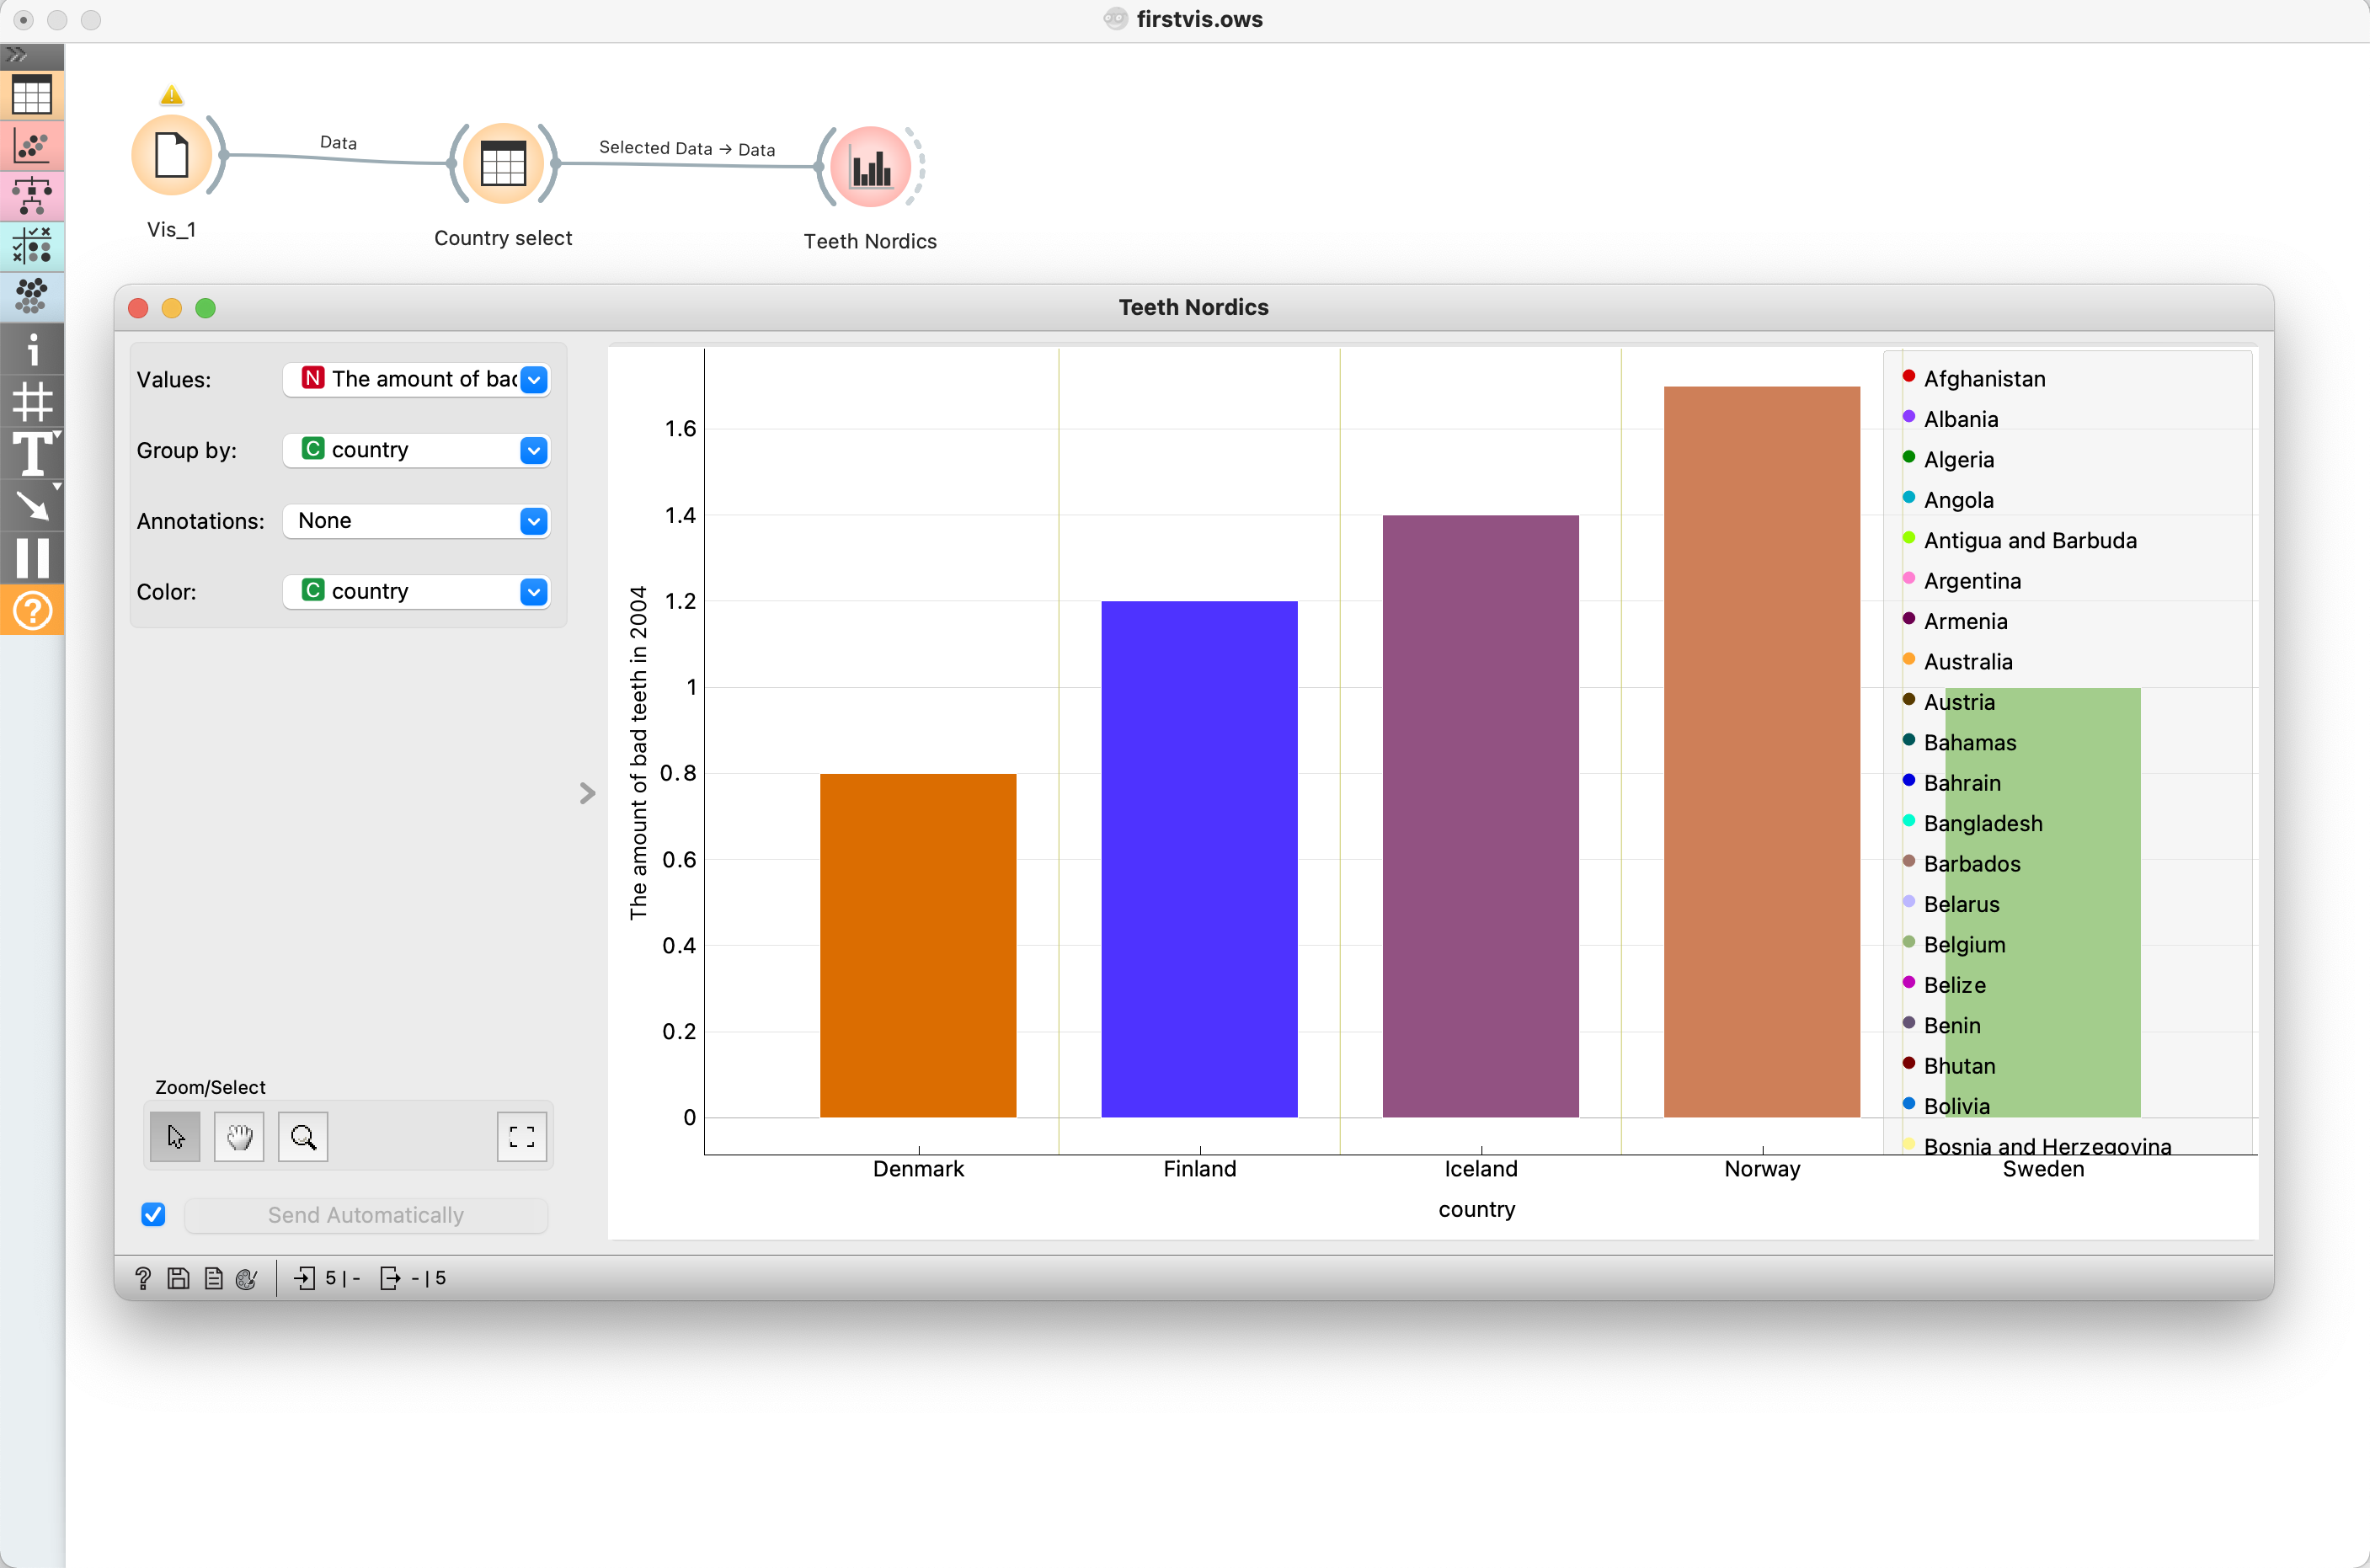
As shown in the attached image, I have a dataset with values for all the world’s countries. I select a small subset of these using Data Table and create a bar plot. I choose to color the bars according to their respective countries. This works, but in addition I get a legend with the colours for all the other countries in the world. There are at least three problems with this legend (maybe this ticket should be split into multiple issues?):
- The legend should show only the countries/colours that are actually used in the plot.
- Since I am grouping by country, their names are listed below the bars, so the legend serves no purpose, but I have not found any way of turning it off.
- The legend overlaps the rightmost bars. Even if I widen the window, the bars widen in proportion, so the legend remains overlapping. It would look much better if I could make space for the legend on the side of the plot itself.
- [ ] How can we reproduce the problem?
Open the attached .ows file, you may have to rebind the data file and redo the selection in the Data Table, but just select some (small) random set of countries. Open the widget “Teeth Nordics” and confirm that the legend is there.
- [ ] What's your environment?
- Operating system: macOS 11.2.2
- Orange version: 3.29.3
- How you installed Orange: From the .dmg on the web site.
Ad 1. This is almost "by design". This information remains in the domain, hence it is shown. The logic is to see everything that is in the data, and see what is missing and what is present in the subset. I agree this makes no sense. I believe the solution would be to place an option in Visual setting to enable showing the "unpurged" domain, but show it purged by default.
Ad 2. Group by and color are not the same thing. These are two different settings, so the legend doesn't necessarily correspond to the group by attribute. However, I agree there should be at least an option to remove the legend.
Ad 3. 100% agree. I get annoyed by this very often, especially when I try to make reasonable plots that can be used in publications or presentations. I'd like to keep the legend, but can prevent it from overlapping. I usually solve this with Inkscape, where I manually move the legend to the side, but this is really not a nice solution. In favour of change.
We also discussed this at today's meeting.
We said that this widget could have a checkbox whether to show values with 0 instances. (Because it would make sense, not because it solves any of these problems.)
Next, we said that there's the same problem in other widgets, say scatter plot. We'd have an option in plot settings whether to show a complete legend or one that contains only what is actually plotted.
The third one is tougher, especially if we want a general solution (again think scatterplot). Two possible options that I see are
- have an option to hide a legend and a button that writes the legend to a file (in widget settings)
- have a legend in a separate popup, also with option to be saved.
Yes, I surmise that there are several settings that should be common to widgets, such as turning legends on and off, setting axis endpoints, titles, and so on. Then there is the issue of diagram real estate. I’m not sure it would be a good idea to have the legend in a separate popup, as that could make it difficult to get a nice shot of the diagram. Ideally one should be able to drag and scale diagrams and legends within the display pane, thus one could drag a legend inside a diagram where there is space for one, or one could place it outside. I realise this may require a major rebuilding of the display code, but somewhere on the longterm road map?
Ok, here's the decision:
- Widgets should have the option to disable the legend (via checkbox):
- [ ] Distribution
- [ ] Bar Plot
- Plot options should let the user decide whether to include the empty categories in the legend or not.