Linux 检查磁盘空间占用情况
Linux 检查磁盘空间占用情况
df -h
[root@CS1 /]# df -h
文件系统                     容量  已用  可用 已用% 挂载点
/dev/mapper/centos_cs1-root   50G  8.1G   42G   17% /
devtmpfs                      16G     0   16G    0% /dev
tmpfs                         16G     0   16G    0% /dev/shm
tmpfs                         16G  9.7M   16G    1% /run
tmpfs                         16G     0   16G    0% /sys/fs/cgroup
/dev/sda1                   1014M  169M  846M   17% /boot
/dev/mapper/centos_cs1-home   42G  2.7G   39G    7% /home
tmpfs                        3.2G   12K  3.2G    1% /run/user/42
tmpfs                        3.2G     0  3.2G    0% /run/user/0
du -sh *
[root@CS1 ~]# du -sh *
4.0K	anaconda-ks.cfg
6.8M	bingoo
4.0K	initial-setup-ks.cfg
Linux find large files quickly with bash alias
alias ducks='du -cks * | sort -rn | head'
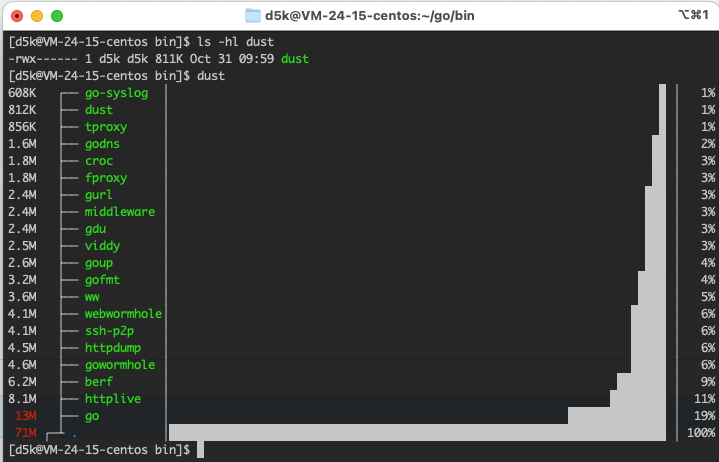
gdu
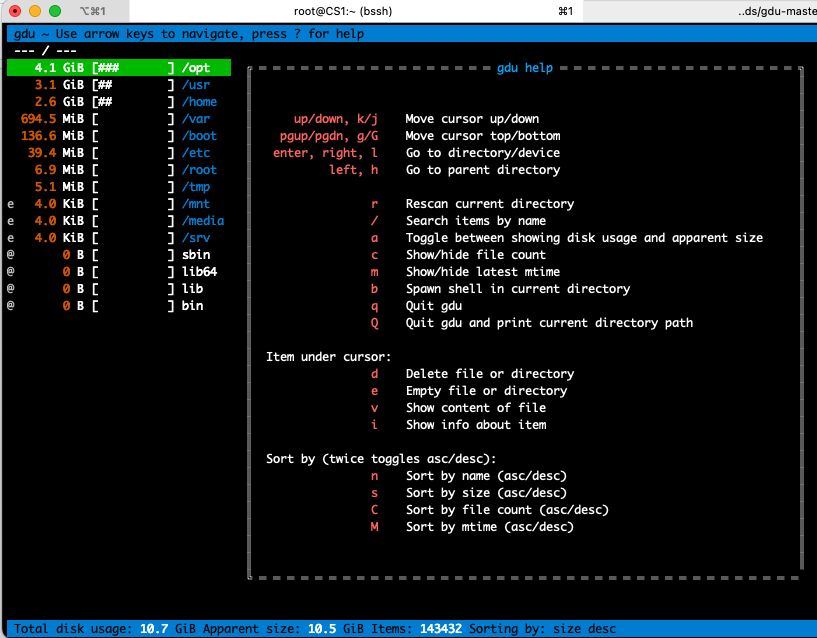
NCurses Disk Usage(ncdu)
fio测试读写速度
- 需要安装fio:
yum install fio -y - 随机读:
fio -filename=/home/data -direct=1 -iodepth 1 -thread -rw=randread -ioengine=psync -bs=16k -numjobs=10 -runtime=60 -group_reporting -name=mytest -size=2G(可直接用,向磁盘写一个2G文件,10线程,随机读1分钟,给出结果) - 顺序读:
fio -filename=/home/data-direct=1 -iodepth 1 -thread -rw=read -ioengine=psync -bs=16k -numjobs=2 -runtime=60 -group_reporting -name=mytest -size=1G - 随机写:
fio -filename=/home/data -direct=1 -iodepth 1 -thread -rw=randwrite -ioengine=psync -bs=16k -numjobs=2 -runtime=60 -group_reporting -name=mytest -size=1G - 顺序写:
fio -filename=/home/data -direct=1 -iodepth 1 -thread -rw=write -ioengine=psync -bs=16k -numjobs=2 -runtime=60 -group_reporting -name=mytest -size=1G - 混合随机读写:
fio -filename=/home/data -direct=1 -iodepth 1 -thread -rw=randrw -rwmixread=70 -ioengine=psync -bs=16k -numjobs=2 -runtime=60 -group_reporting -name=mytest -ioscheduler=noop -size=1G
云盘性能测试命令
- 随机写IOPS:
fio -direct=1 -iodepth=128 -rw=randwrite -ioengine=libaio -bs=4k -size=1G -numjobs=1 -runtime=1000 -group_reporting -filename=/dev/your_device -name=Rand_Write_Testing - 随机读IOPS:
fio -direct=1 -iodepth=128 -rw=randread -ioengine=libaio -bs=4k -size=1G -numjobs=1 -runtime=1000 -group_reporting -filename=/dev/your_device -name=Rand_Read_Testing - 顺序写吞吐量:
fio -direct=1 -iodepth=64 -rw=write -ioengine=libaio -bs=1024k -size=1G -numjobs=1 -runtime=1000 -group_reporting -filename=/dev/your_device -name=Write_PPS_Testing - 顺序读吞吐量:
fio -direct=1 -iodepth=64 -rw=read -ioengine=libaio -bs=1024k -size=1G -numjobs=1 -runtime=1000 -group_reporting -filename=/dev/your_device -name=Read_PPS_Testing - 随机写时延:
fio -direct=1 -iodepth=1 -rw=randwrite -ioengine=libaio -bs=4k -size=1G -numjobs=1 -group_reporting -filename=/dev/your_device -name=Rand_Write_Latency_Testing - 随机读时延:
fio -direct=1 -iodepth=1 -rw=randread -ioengine=libaio -bs=4k -size=1G -numjobs=1 -group_reporting -filename=/dev/your_device -name=Rand_Read_Latency_Testing
本地盘性能测试命令
以下测试命令适用于NVMe SSD本地盘和SATA HDD本地盘。
说明 本示例中,使用的设备名为/dev/your_device,请您根据实际情况替换。例如需要测试的本地盘为/dev/vdb,则将以下示例命令中的/dev/your_device替换为/dev/vdb。
- 随机写IOPS:
fio -direct=1 -iodepth=32 -rw=randwrite -ioengine=libaio -bs=4k -numjobs=4 -time_based=1 -runtime=1000 -group_reporting -filename=/dev/your_device -name=test - 随机读IOPS:
fio -direct=1 -iodepth=32 -rw=randread -ioengine=libaio -bs=4k -numjobs=4 -time_based=1 -runtime=1000 -group_reporting -filename=/dev/your_device -name=test - 顺序写吞吐量:
fio -direct=1 -iodepth=128 -rw=write -ioengine=libaio -bs=128k -numjobs=1 -time_based=1 -runtime=1000 -group_reporting -filename=/dev/your_device -name=test - 顺序读吞吐量:
fio -direct=1 -iodepth=128 -rw=read -ioengine=libaio -bs=128k -numjobs=1 -time_based=1 -runtime=1000 -group_reporting -filename=/dev/your_device -name=test - 随机写延迟:
fio -direct=1 -iodepth=1 -rw=randwrite -ioengine=libaio -bs=4k -numjobs=1 -time_based=1 -runtime=1000 -group_reporting -filename=/dev/your_device -name=test - 随机读延迟:
fio -direct=1 -iodepth=1 -rw=randread -ioengine=libaio -bs=4k -numjobs=1 -time_based=1 -runtime=1000 -group_reporting -filename=/dev/your_device -name=test - 顺序写延迟:
fio -direct=1 -iodepth=1 -rw=write -ioengine=libaio -bs=4k -numjobs=1 -time_based=1 -runtime=1000 -group_reporting -filename=/dev/your_device -name=test - 顺序读延迟:
fio -direct=1 -iodepth=1 -rw=read -ioengine=libaio -bs=4k -numjobs=1 -time_based=1 -runtime=1000 -group_reporting -filename=/dev/your_device -name=test
参数说明:
说明:
- filename=/home/data 测试文件名称,通常选择需要测试的盘的data目录。和dd命令中的of输出文件类似
- direct=1 测试过程绕过机器自带的buffer。使测试结果更真实。
- rw=randwrite 测试随机写的I/O
- rw=randrw 测试随机写和读的I/O
- bs=16k 单次io的块文件大小为16k
- bsrange=512-2048 同上,提定数据块的大小范围
- size=5g 本次的测试文件大小为5g,以每次4k的io进行测试。
- numjobs=30 本次的测试线程为30.
- runtime=1000 测试时间为1000秒,如果不写则一直将5g文件分4k每次写完为止。
- ioengine=psync io引擎使用pync方式
- rwmixwrite=30 在混合读写的模式下,写占30%
- group_reporting 关于显示结果的,汇总每个进程的信息。
- lockmem=1g 只使用1g内存进行测试。
- zero_buffers 用0初始化系统buffer。
- nrfiles=8 每个进程生成文件的数量。
- read 顺序读
- write 顺序写
- rw,readwrite 顺序混合读写
- randwrite 随机写
- randread 随机读
- randrw 随机混合读写
- io总的输入输出量
- bw 带宽 KB/s
- iops 每秒钟的IO数
- runt 总运行时间
- lat (msec) 延迟(毫秒)
- msec 毫秒
- usec 微秒
我的腾讯云盘测试结果
| 随机读 | 顺序读 | 随机写 | 顺序写 | 混合随机读写 |
|---|---|---|---|---|
| 69.0MB/s 4189 IOPS | 365MiB/s 23.3k IOPS | 7816KiB/s 488 IOPS | 14.6MiB/s 936 IOPS | 16.0KiB |
顺序写结果 129MiB/s 16.5k IOPS:fio -direct=1 -iodepth=64 -rw=write -ioengine=libaio -bs=8k -size=10G -numjobs=1 -runtime=1000 -group_reporting -name=/storage/iotest
磁盘类型
妥妥的旋转磁盘 HDD
[d5k@VM-24-15-centos ~]$ lsscsi
[0:0:1:0]    cd/dvd  QEMU     QEMU DVD-ROM     2.5+  /dev/sr0
[d5k@VM-24-15-centos ~]$ lsblk -d -o name,rota
NAME ROTA
sr0     1
vda     1
随机读
fio -filename=/home/data -direct=1 -iodepth 1 -thread -rw=randread -ioengine=psync -bs=16k -numjobs=10 -runtime=60 -group_reporting -name=mytest -size=2G
[root@VM-24-15-centos d5k]# fio -filename=/home/data -direct=1 -iodepth 1 -thread -rw=randread -ioengine=psync -bs=16k -numjobs=10 -runtime=60 -group_reporting -name=mytest -size=2G
mytest: (g=0): rw=randread, bs=(R) 16.0KiB-16.0KiB, (W) 16.0KiB-16.0KiB, (T) 16.0KiB-16.0KiB, ioengine=psync, iodepth=1
...
fio-3.19
Starting 10 threads
Jobs: 10 (f=10): [r(10)][100.0%][r=65.5MiB/s][r=4189 IOPS][eta 00m:00s]
mytest: (groupid=0, jobs=10): err= 0: pid=3367462: Fri Mar 25 15:37:47 2022
  read: IOPS=4269, BW=66.7MiB/s (69.0MB/s)(4003MiB/60001msec)
    clat (usec): min=477, max=23063, avg=2339.88, stdev=899.09
     lat (usec): min=477, max=23064, avg=2340.14, stdev=899.09
    clat percentiles (usec):
     |  1.00th=[  668],  5.00th=[  930], 10.00th=[ 1401], 20.00th=[ 1844],
     | 30.00th=[ 1975], 40.00th=[ 2073], 50.00th=[ 2180], 60.00th=[ 2376],
     | 70.00th=[ 2638], 80.00th=[ 2868], 90.00th=[ 3195], 95.00th=[ 3752],
     | 99.00th=[ 5604], 99.50th=[ 6390], 99.90th=[ 8160], 99.95th=[ 9241],
     | 99.99th=[12125]
   bw (  KiB/s): min=63967, max=148603, per=99.84%, avg=68207.73, stdev=795.46, samples=1190
   iops        : min= 3997, max= 9284, avg=4262.69, stdev=49.69, samples=1190
  lat (usec)   : 500=0.01%, 750=2.21%, 1000=3.65%
  lat (msec)   : 2=27.33%, 4=62.79%, 10=3.99%, 20=0.03%, 50=0.01%
  cpu          : usr=0.14%, sys=1.97%, ctx=256206, majf=0, minf=40
  IO depths    : 1=100.0%, 2=0.0%, 4=0.0%, 8=0.0%, 16=0.0%, 32=0.0%, >=64=0.0%
     submit    : 0=0.0%, 4=100.0%, 8=0.0%, 16=0.0%, 32=0.0%, 64=0.0%, >=64=0.0%
     complete  : 0=0.0%, 4=100.0%, 8=0.0%, 16=0.0%, 32=0.0%, 64=0.0%, >=64=0.0%
     issued rwts: total=256185,0,0,0 short=0,0,0,0 dropped=0,0,0,0
     latency   : target=0, window=0, percentile=100.00%, depth=1

Run status group 0 (all jobs):
   READ: bw=66.7MiB/s (69.0MB/s), 66.7MiB/s-66.7MiB/s (69.0MB/s-69.0MB/s), io=4003MiB (4197MB), run=60001-60001msec

Disk stats (read/write):
  vda: ios=256181/325, merge=0/137, ticks=585366/923, in_queue=586288, util=99.61%
顺序读
fio -filename=/home/data-direct=1 -iodepth 1 -thread -rw=read -ioengine=psync -bs=16k -numjobs=2 -runtime=60 -group_reporting -name=mytest -size=1G
[root@VM-24-15-centos d5k]# fio -filename=/home/data-direct=1 -iodepth 1 -thread -rw=read -ioengine=psync -bs=16k -numjobs=2 -runtime=60 -group_reporting -name=mytest -size=1G
mytest: (g=0): rw=read, bs=(R) 16.0KiB-16.0KiB, (W) 16.0KiB-16.0KiB, (T) 16.0KiB-16.0KiB, ioengine=psync, iodepth=1
...
fio-3.19
Starting 2 threads
Jobs: 2 (f=2): [R(2)][-.-%][r=365MiB/s][r=23.3k IOPS][eta 00m:00s]
mytest: (groupid=0, jobs=2): err= 0: pid=3367809: Fri Mar 25 15:38:24 2022
  read: IOPS=39.4k, BW=616MiB/s (645MB/s)(2048MiB/3327msec)
    clat (nsec): min=981, max=28161k, avg=48796.70, stdev=343874.81
     lat (nsec): min=1022, max=28161k, avg=48875.92, stdev=343873.97
    clat percentiles (nsec):
     |  1.00th=[    1384],  5.00th=[    1480], 10.00th=[    1560],
     | 20.00th=[    1768], 30.00th=[    1928], 40.00th=[    2096],
     | 50.00th=[    2256], 60.00th=[    2416], 70.00th=[    2608],
     | 80.00th=[    3120], 90.00th=[    4320], 95.00th=[  154624],
     | 99.00th=[ 1220608], 99.50th=[ 1826816], 99.90th=[ 4112384],
     | 99.95th=[ 5472256], 99.99th=[13828096]
   bw (  KiB/s): min=356544, max=1366828, per=96.73%, avg=609739.50, stdev=181875.29, samples=12
   iops        : min=22284, max=85426, avg=38108.33, stdev=11367.09, samples=12
  lat (nsec)   : 1000=0.01%
  lat (usec)   : 2=33.72%, 4=54.28%, 10=3.82%, 20=0.85%, 50=0.65%
  lat (usec)   : 100=0.92%, 250=1.72%, 500=1.40%, 750=0.75%, 1000=0.57%
  lat (msec)   : 2=0.87%, 4=0.34%, 10=0.09%, 20=0.01%, 50=0.01%
  cpu          : usr=1.58%, sys=12.12%, ctx=9550, majf=0, minf=6
  IO depths    : 1=100.0%, 2=0.0%, 4=0.0%, 8=0.0%, 16=0.0%, 32=0.0%, >=64=0.0%
     submit    : 0=0.0%, 4=100.0%, 8=0.0%, 16=0.0%, 32=0.0%, 64=0.0%, >=64=0.0%
     complete  : 0=0.0%, 4=100.0%, 8=0.0%, 16=0.0%, 32=0.0%, 64=0.0%, >=64=0.0%
     issued rwts: total=131072,0,0,0 short=0,0,0,0 dropped=0,0,0,0
     latency   : target=0, window=0, percentile=100.00%, depth=1

Run status group 0 (all jobs):
   READ: bw=616MiB/s (645MB/s), 616MiB/s-616MiB/s (645MB/s-645MB/s), io=2048MiB (2147MB), run=3327-3327msec

Disk stats (read/write):
  vda: ios=17444/1, merge=2615/0, ticks=312414/9, in_queue=312423, util=94.22%
随机写
fio -filename=/home/data -direct=1 -iodepth 1 -thread -rw=randwrite -ioengine=psync -bs=16k -numjobs=2 -runtime=60 -group_reporting -name=mytest -size=1G
[root@VM-24-15-centos d5k]# fio -filename=/home/data -direct=1 -iodepth 1 -thread -rw=randwrite -ioengine=psync -bs=16k -numjobs=2 -runtime=60 -group_reporting -name=mytest -size=1G
mytest: (g=0): rw=randwrite, bs=(R) 16.0KiB-16.0KiB, (W) 16.0KiB-16.0KiB, (T) 16.0KiB-16.0KiB, ioengine=psync, iodepth=1
...
fio-3.19
Starting 2 threads
Jobs: 2 (f=2): [w(2)][100.0%][w=7816KiB/s][w=488 IOPS][eta 00m:00s]
mytest: (groupid=0, jobs=2): err= 0: pid=3368030: Fri Mar 25 15:40:26 2022
  write: IOPS=717, BW=11.2MiB/s (11.8MB/s)(673MiB/60008msec); 0 zone resets
    clat (usec): min=639, max=61033, avg=2783.83, stdev=3288.65
     lat (usec): min=639, max=61034, avg=2784.24, stdev=3288.68
    clat percentiles (usec):
     |  1.00th=[  734],  5.00th=[  783], 10.00th=[  824], 20.00th=[  873],
     | 30.00th=[  930], 40.00th=[ 1004], 50.00th=[ 1123], 60.00th=[ 1500],
     | 70.00th=[ 2212], 80.00th=[ 4752], 90.00th=[ 7570], 95.00th=[ 9372],
     | 99.00th=[14222], 99.50th=[17171], 99.90th=[25035], 99.95th=[28967],
     | 99.99th=[41157]
   bw (  KiB/s): min= 4640, max=20608, per=100.00%, avg=11523.52, stdev=1747.77, samples=238
   iops        : min=  290, max= 1288, avg=720.19, stdev=109.25, samples=238
  lat (usec)   : 750=1.78%, 1000=38.26%
  lat (msec)   : 2=27.62%, 4=10.50%, 10=17.87%, 20=3.71%, 50=0.26%
  lat (msec)   : 100=0.01%
  cpu          : usr=0.20%, sys=4.42%, ctx=86148, majf=0, minf=0
  IO depths    : 1=100.0%, 2=0.0%, 4=0.0%, 8=0.0%, 16=0.0%, 32=0.0%, >=64=0.0%
     submit    : 0=0.0%, 4=100.0%, 8=0.0%, 16=0.0%, 32=0.0%, 64=0.0%, >=64=0.0%
     complete  : 0=0.0%, 4=100.0%, 8=0.0%, 16=0.0%, 32=0.0%, 64=0.0%, >=64=0.0%
     issued rwts: total=0,43070,0,0 short=0,0,0,0 dropped=0,0,0,0
     latency   : target=0, window=0, percentile=100.00%, depth=1

Run status group 0 (all jobs):
  WRITE: bw=11.2MiB/s (11.8MB/s), 11.2MiB/s-11.2MiB/s (11.8MB/s-11.8MB/s), io=673MiB (706MB), run=60008-60008msec

Disk stats (read/write):
  vda: ios=6/43169, merge=0/137, ticks=0/57501, in_queue=57502, util=98.75%
顺序写
[root@VM-24-15-centos d5k]# fio -direct=1 -iodepth=64  -rw=write -ioengine=libaio -bs=8k -size=10G  -numjobs=1  -runtime=1000  -group_reporting  -name=/storage/iotest
/storage/iotest: (g=0): rw=write, bs=(R) 8192B-8192B, (W) 8192B-8192B, (T) 8192B-8192B, ioengine=libaio, iodepth=64
fio-3.19
Starting 1 process
Jobs: 1 (f=1): [W(1)][100.0%][w=129MiB/s][w=16.5k IOPS][eta 00m:00s]
/storage/iotest: (groupid=0, jobs=1): err= 0: pid=3376345: Fri Mar 25 16:20:11 2022
  write: IOPS=16.8k, BW=131MiB/s (138MB/s)(10.0GiB/78066msec); 0 zone resets
    slat (nsec): min=1913, max=7876.2k, avg=5970.59, stdev=22676.27
    clat (usec): min=91, max=57780, avg=3804.98, stdev=2105.13
     lat (usec): min=573, max=57784, avg=3811.09, stdev=2105.34
    clat percentiles (usec):
     |  1.00th=[ 1205],  5.00th=[ 1745], 10.00th=[ 2057], 20.00th=[ 2409],
     | 30.00th=[ 2671], 40.00th=[ 2933], 50.00th=[ 3228], 60.00th=[ 3621],
     | 70.00th=[ 4080], 80.00th=[ 4817], 90.00th=[ 6521], 95.00th=[ 7963],
     | 99.00th=[10814], 99.50th=[12649], 99.90th=[19006], 99.95th=[23200],
     | 99.99th=[41157]
   bw (  KiB/s): min=66736, max=181760, per=100.00%, avg=134508.12, stdev=20850.59, samples=155
   iops        : min= 8342, max=22720, avg=16813.49, stdev=2606.30, samples=155
  lat (usec)   : 100=0.01%, 250=0.01%, 500=0.01%, 750=0.02%, 1000=0.33%
  lat (msec)   : 2=8.45%, 4=59.86%, 10=29.90%, 20=1.35%, 50=0.08%
  lat (msec)   : 100=0.01%
  cpu          : usr=3.31%, sys=11.78%, ctx=129883, majf=0, minf=11
  IO depths    : 1=0.1%, 2=0.1%, 4=0.1%, 8=0.1%, 16=0.1%, 32=0.1%, >=64=100.0%
     submit    : 0=0.0%, 4=100.0%, 8=0.0%, 16=0.0%, 32=0.0%, 64=0.0%, >=64=0.0%
     complete  : 0=0.0%, 4=100.0%, 8=0.0%, 16=0.0%, 32=0.0%, 64=0.1%, >=64=0.0%
     issued rwts: total=0,1310720,0,0 short=0,0,0,0 dropped=0,0,0,0
     latency   : target=0, window=0, percentile=100.00%, depth=64

Run status group 0 (all jobs):
  WRITE: bw=131MiB/s (138MB/s), 131MiB/s-131MiB/s (138MB/s-138MB/s), io=10.0GiB (10.7GB), run=78066-78066msec

Disk stats (read/write):
  vda: ios=44/1310019, merge=0/241, ticks=284/4863571, in_queue=4863855, util=99.91%
fio -filename=/home/data -direct=1 -iodepth 1 -thread -rw=write -ioengine=psync -bs=16k -numjobs=2 -runtime=60 -group_reporting -name=mytest -size=1G
[root@VM-24-15-centos d5k]# fio -filename=/home/data -direct=1 -iodepth 1 -thread -rw=write -ioengine=psync -bs=16k -numjobs=2 -runtime=60 -group_reporting -name=mytest -size=1G
mytest: (g=0): rw=write, bs=(R) 16.0KiB-16.0KiB, (W) 16.0KiB-16.0KiB, (T) 16.0KiB-16.0KiB, ioengine=psync, iodepth=1
...
fio-3.19
Starting 2 threads
Jobs: 2 (f=2): [W(2)][100.0%][w=14.6MiB/s][w=936 IOPS][eta 00m:00s]
mytest: (groupid=0, jobs=2): err= 0: pid=3368436: Fri Mar 25 15:42:16 2022
  write: IOPS=888, BW=13.9MiB/s (14.6MB/s)(833MiB/60004msec); 0 zone resets
    clat (usec): min=570, max=45874, avg=2249.03, stdev=2763.71
     lat (usec): min=571, max=45874, avg=2249.46, stdev=2763.74
    clat percentiles (usec):
     |  1.00th=[  652],  5.00th=[  701], 10.00th=[  734], 20.00th=[  775],
     | 30.00th=[  816], 40.00th=[  865], 50.00th=[  930], 60.00th=[ 1057],
     | 70.00th=[ 1483], 80.00th=[ 2933], 90.00th=[ 6915], 95.00th=[ 7898],
     | 99.00th=[11994], 99.50th=[13960], 99.90th=[18482], 99.95th=[21627],
     | 99.99th=[29754]
   bw (  KiB/s): min= 6848, max=21280, per=100.00%, avg=14229.20, stdev=1480.98, samples=238
   iops        : min=  428, max= 1330, avg=889.29, stdev=92.57, samples=238
  lat (usec)   : 750=13.77%, 1000=42.49%
  lat (msec)   : 2=19.78%, 4=6.08%, 10=15.73%, 20=2.07%, 50=0.07%
  cpu          : usr=0.27%, sys=4.38%, ctx=106607, majf=0, minf=0
  IO depths    : 1=100.0%, 2=0.0%, 4=0.0%, 8=0.0%, 16=0.0%, 32=0.0%, >=64=0.0%
     submit    : 0=0.0%, 4=100.0%, 8=0.0%, 16=0.0%, 32=0.0%, 64=0.0%, >=64=0.0%
     complete  : 0=0.0%, 4=100.0%, 8=0.0%, 16=0.0%, 32=0.0%, 64=0.0%, >=64=0.0%
     issued rwts: total=0,53304,0,0 short=0,0,0,0 dropped=0,0,0,0
     latency   : target=0, window=0, percentile=100.00%, depth=1

Run status group 0 (all jobs):
  WRITE: bw=13.9MiB/s (14.6MB/s), 13.9MiB/s-13.9MiB/s (14.6MB/s-14.6MB/s), io=833MiB (873MB), run=60004-60004msec

Disk stats (read/write):
  vda: ios=6/53607, merge=0/130, ticks=0/58028, in_queue=58029, util=98.87%
混合随机读写
fio -filename=/home/data -direct=1 -iodepth 1 -thread -rw=randrw -rwmixread=70 -ioengine=psync -bs=16k -numjobs=2 -runtime=60 -group_reporting -name=mytest -ioscheduler=noop -size=1G
[root@VM-24-15-centos d5k]# fio -filename=/home/data -direct=1 -iodepth 1 -thread -rw=randrw -rwmixread=70 -ioengine=psync -bs=16k -numjobs=2 -runtime=60 -group_reporting -name=mytest -ioscheduler=noop -size=1G
mytest: (g=0): rw=randrw, bs=(R) 16.0KiB-16.0KiB, (W) 16.0KiB-16.0KiB, (T) 16.0KiB-16.0KiB, ioengine=psync, iodepth=1
...
fio-3.19
Starting 2 threads
fio: io scheduler noop not found
fio: io scheduler noop not found
fio: pid=3368708, err=22/file:backend.c:1416, func=iosched_switch, error=Invalid argument
fio: pid=3368709, err=22/file:backend.c:1416, func=iosched_switch, error=Invalid argument


Run status group 0 (all jobs):

Disk stats (read/write):
  vda: ios=0/0, merge=0/0, ticks=0/0, in_queue=0, util=0.00%

#include <stdio.h>

int main()
{
    printf("The BUFSIZ is %d\n", BUFSIZ);
    return 0;
}
[root@VM-24-15-centos d5k]# cc bufsize.c
[root@VM-24-15-centos d5k]# ./a.out
The BUFSIZ is 8192
[root@VM-24-15-centos d5k]# blockdev --getbsz /dev/vda1 4096
递归列举目录下文件大小
- 列举文件大小
find . -type f -ls| awk '{print $7,$NF}' - 列举目录大小
du --max-depth=1