bingoogolapple.github.io
 bingoogolapple.github.io copied to clipboard
GC 日志分析基础
并行与并发
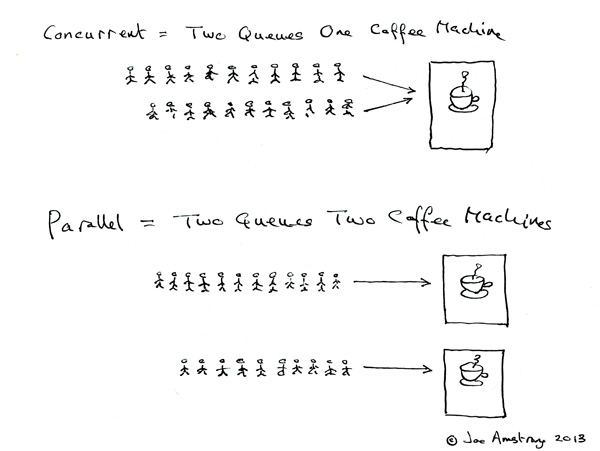
- Concurrent:并发, 多个线程协同做同一件事情(有状态)
- Parallel:并行, 多个线程各做各的事情(互相间无共享状态)
延迟(Latency)、响应能力(Responsiveness)
- 响应能力就是程序或系统对一个请求的响应有多迅速
- 程序UI响应速度有多灵敏
- 网站页面响应有多快
- 数据库查询有多快
- 对响应速度要求很高的系统,较大的停顿时间是不可接受的。重点是在非常短的时间周期内快速响应
吞吐量(Throughput)
- 吞吐量关注在一个特定时间段内应用系统的最大工作量
- 给定时间内完成的事务数
- 每小时批处理系统能完成的作业数量
- 每小时能完成多少次数据库查询
- 在吞吐量方面优化的系统,停顿时间长也是可以接受的。由于高吞吐量应用运行时间长,所以此时更关心的是如何尽可能快地完成整个任务,而不考虑快速响应
2017-07-27T11:46:52.850-0800: 8.539: [GC (Allocation Failure)
  2017-07-27T11:46:52.850-0800: 8.539: [DefNew: 559232K->559232K(629120K), 0.0000369 secs]
  2017-07-27T11:46:52.850-0800: 8.540: [Tenured: 1350816K->1398131K(1398144K), 1.9093987 secs]
  1910048K->1459886K(2027264K),
  [Metaspace: 3144K->3144K(1056768K)],
1.9096311 secs]
[Times: user=0.58 sys=0.72, real=1.91 secs]
2017-07-27T11:46:52.850-0800(开始垃圾收集时的当前时间戳): 8.539(JVM 启动后经过的时间,单位为秒): [GC (Allocation Failure(导致 GC 的原因,这里是分配内存失败导致的))
  2017-07-27T11:46:52.850-0800: 8.539: [DefNew(Serial GC 年轻代内存区域名称 Default New Generation,单线程,标记-复制 Mark-Copy,STW): 559232K(GC 前年轻代的使用量)->559232K(GC 后年轻代的使用量)(629120K(年轻代总大小)), 0.0000369 secs(年轻代 GC 所占用的时间,单位为秒)]
  2017-07-27T11:46:52.850-0800: 8.540: [Tenured(Serial GC 老年代内存区域名称,单线程,标记-清除-整理 Mark-Sweep-Compact,STW): 1350816K(GC 前老年代的使用量)->1398131K(GC 后老年代的使用量)(1398144K(老年代代总大小)), 1.9093987 secs(老年代 GC 所占用的时间,单位为秒)]
  1910048K(GC 前整个堆的使用量)->1459886K(GC 后整个堆的使用量)(2027264K(整个堆的总大小)),
  [Metaspace: 3144K->3144K(1056768K)],
1.9096311 secs(本次 GC 的总时间,单位为秒)]
[Times: user=0.58(用户消耗的 CPU 时间) sys=0.72(系统消耗的 CPU 时间), real=1.91(操作从开始到结束所经过的墙钟时间) secs]
- CPU 时间与墙钟时间的区别是,墙钟时间包括各种非运算的等待耗时,例如等待磁盘 I/O、等待线程阻塞,而 CPU 时间不包括这些耗时,但当系统有多 CPU 或者多核的话,多线程操作会叠加这些 CPU 时间,所以 user 或 sys 时间超过 real 时间是完全正常的
「-Xloggc:./log/SerialGC.log」把 GC 日志输出至文件
输出从 JVM 启动后经过的时间,单位为秒「-XX:+PrintGCTimeStamps」
java -jar -Xms2g -Xmx2g -Xss256k -XX:+UseSerialGC -Xloggc:./log/SerialGC.log -XX:+PrintGC -XX:+PrintGCTimeStamps build/libs/tuning-1.0.jar
Java HotSpot(TM) 64-Bit Server VM (25.131-b11) for bsd-amd64 JRE (1.8.0_131-b11), built on Mar 15 2017 01:32:22 by "java_re" with gcc 4.2.1 (Based on Apple Inc. build 5658) (LLVM build 2336.11.00)
Memory: 4k page, physical 8388608k(1265088k free)

/proc/meminfo:

CommandLine flags: -XX:InitialHeapSize=2147483648 -XX:MaxHeapSize=2147483648 -XX:+PrintGC -XX:+PrintGCTimeStamps -XX:ThreadStackSize=256 -XX:+UseCompressedClassPointers -XX:+UseCompressedOops -XX:+UseSerialGC
2.181: [GC (Allocation Failure)  559232K->528426K(2027264K), 0.4397562 secs]
4.371: [GC (Allocation Failure)  1087658K->1077217K(2027264K), 0.9934751 secs]
6.472: [Full GC (Allocation Failure)  1636257K->1352301K(2027264K), 0.9943822 secs]
8.670: [Full GC (Allocation Failure)  1911444K->1462293K(2027264K), 1.2859573 secs]
10.779: [Full GC (Allocation Failure)  2027057K->1572567K(2027264K), 0.4897855 secs]
12.574: [Full GC (Allocation Failure)  2027112K->1664760K(2027264K), 0.5289357 secs]
13.970: [Full GC (Allocation Failure)  2027047K->1806310K(2027264K), 0.4592903 secs]
14.871: [Full GC (Allocation Failure)  2027110K->1852254K(2027264K), 0.4380061 secs]
输出包含日期的 GC 日志「-XX:+PrintGCDateStamps」
java -jar -Xms2g -Xmx2g -Xss256k -XX:+UseSerialGC -Xloggc:./log/SerialGC.log -XX:+PrintGC -XX:+PrintGCTimeStamps -XX:+PrintGCDateStamps build/libs/tuning-1.0.jar
Java HotSpot(TM) 64-Bit Server VM (25.131-b11) for bsd-amd64 JRE (1.8.0_131-b11), built on Mar 15 2017 01:32:22 by "java_re" with gcc 4.2.1 (Based on Apple Inc. build 5658) (LLVM build 2336.11.00)
Memory: 4k page, physical 8388608k(1307184k free)

/proc/meminfo:

CommandLine flags: -XX:InitialHeapSize=2147483648 -XX:MaxHeapSize=2147483648 -XX:+PrintGC -XX:+PrintGCDateStamps -XX:+PrintGCTimeStamps -XX:ThreadStackSize=256 -XX:+UseCompressedClassPointers -XX:+UseCompressedOops -XX:+UseSerialGC
2017-07-27T11:44:20.317-0800: 2.151: [GC (Allocation Failure)  559232K->527812K(2027264K), 0.4573597 secs]
2017-07-27T11:44:22.505-0800: 4.339: [GC (Allocation Failure)  1087044K->1077166K(2027264K), 1.0778414 secs]
2017-07-27T11:44:24.611-0800: 6.445: [Full GC (Allocation Failure)  1636398K->1352301K(2027264K), 1.5210387 secs]
2017-07-27T11:44:26.810-0800: 8.644: [Full GC (Allocation Failure)  1911533K->1465007K(2027264K), 1.1039530 secs]
2017-07-27T11:44:28.918-0800: 10.752: [Full GC (Allocation Failure)  2027106K->1572567K(2027264K), 0.5277139 secs]
2017-07-27T11:44:30.711-0800: 12.545: [Full GC (Allocation Failure)  2026874K->1664760K(2027264K), 0.5246016 secs]
2017-07-27T11:44:32.110-0800: 13.944: [Full GC (Allocation Failure)  2027148K->1736467K(2027264K), 0.4542989 secs]
2017-07-27T11:44:33.309-0800: 15.143: [Full GC (Allocation Failure)  2027063K->1793576K(2027264K), 0.4464888 secs]
输出详细的 GC 日志「-XX:+PrintGCDetails」
java -jar -Xms2g -Xmx2g -Xss256k -XX:+UseSerialGC -Xloggc:./log/SerialGC.log -XX:+PrintGC -XX:+PrintGCTimeStamps -XX:+PrintGCDateStamps -XX:+PrintGCDetails build/libs/tuning-1.0.jar
Java HotSpot(TM) 64-Bit Server VM (25.131-b11) for bsd-amd64 JRE (1.8.0_131-b11), built on Mar 15 2017 01:32:22 by "java_re" with gcc 4.2.1 (Based on Apple Inc. build 5658) (LLVM build 2336.11.00)
Memory: 4k page, physical 8388608k(1696664k free)

/proc/meminfo:

CommandLine flags: -XX:InitialHeapSize=2147483648 -XX:MaxHeapSize=2147483648 -XX:+PrintGC -XX:+PrintGCDateStamps -XX:+PrintGCDetails -XX:+PrintGCTimeStamps -XX:ThreadStackSize=256 -XX:+UseCompressedClassPointers -XX:+UseCompressedOops -XX:+UseSerialGC
2017-07-27T11:46:46.456-0800: 2.145: [GC (Allocation Failure) 2017-07-27T11:46:46.456-0800: 2.145: [DefNew: 559232K->69888K(629120K), 0.5753549 secs] 559232K->526575K(2027264K), 0.5755047 secs] [Times: user=0.19 sys=0.30, real=0.58 secs]
2017-07-27T11:46:48.645-0800: 4.335: [GC (Allocation Failure) 2017-07-27T11:46:48.646-0800: 4.335: [DefNew: 629120K->69862K(629120K), 0.5569546 secs] 1085807K->1076039K(2027264K), 0.5571173 secs] [Times: user=0.20 sys=0.32, real=0.56 secs]
2017-07-27T11:46:50.751-0800: 6.440: [GC (Allocation Failure) 2017-07-27T11:46:50.751-0800: 6.440: [DefNew: 628968K->628968K(629120K), 0.0000349 secs]2017-07-27T11:46:50.751-0800: 6.440: [Tenured: 1006177K->1350816K(1398144K), 1.4477151 secs] 1635145K->1350816K(2027264K), [Metaspace: 3143K->3143K(1056768K)], 1.4505060 secs] [Times: user=0.55 sys=0.32, real=1.45 secs]
2017-07-27T11:46:52.850-0800: 8.539: [GC (Allocation Failure) 2017-07-27T11:46:52.850-0800: 8.539: [DefNew: 559232K->559232K(629120K), 0.0000369 secs]2017-07-27T11:46:52.850-0800: 8.540: [Tenured: 1350816K->1398131K(1398144K), 1.9093987 secs] 1910048K->1459886K(2027264K), [Metaspace: 3144K->3144K(1056768K)], 1.9096311 secs] [Times: user=0.58 sys=0.72, real=1.91 secs]
2017-07-27T11:46:55.058-0800: 10.748: [Full GC (Allocation Failure) 2017-07-27T11:46:55.059-0800: 10.748: [Tenured: 1398131K->1398007K(1398144K), 0.6177521 secs] 2027055K->1572567K(2027264K), [Metaspace: 3145K->3145K(1056768K)], 0.6179462 secs] [Times: user=0.52 sys=0.02, real=0.62 secs]
2017-07-27T11:46:56.847-0800: 12.536: [Full GC (Allocation Failure) 2017-07-27T11:46:56.847-0800: 12.536: [Tenured: 1398007K->1398019K(1398144K), 0.5266798 secs] 2026984K->1664760K(2027264K), [Metaspace: 3145K->3145K(1056768K)], 0.5268084 secs] [Times: user=0.52 sys=0.01, real=0.53 secs]
2017-07-27T11:46:58.246-0800: 13.935: [Full GC (Allocation Failure) 2017-07-27T11:46:58.246-0800: 13.935: [Tenured: 1398019K->1398138K(1398144K), 0.5425898 secs] 2027047K->1736467K(2027264K), [Metaspace: 3158K->3158K(1056768K)], 0.5431311 secs] [Times: user=0.50 sys=0.01, real=0.54 secs]
2017-07-27T11:46:59.351-0800: 15.040: [Full GC (Allocation Failure) 2017-07-27T11:46:59.351-0800: 15.040: [Tenured: 1398138K->1398096K(1398144K), 0.5075115 secs] 2027062K->1823121K(2027264K), [Metaspace: 3158K->3158K(1056768K)], 0.5076914 secs] [Times: user=0.46 sys=0.01, real=0.50 secs]
Heap
 def new generation   total 629120K, used 449282K [0x0000000740000000, 0x000000076aaa0000, 0x000000076aaa0000)
  eden space 559232K,  80% used [0x0000000740000000, 0x000000075b6c08d8, 0x0000000762220000)
  from space 69888K,   0% used [0x0000000762220000, 0x0000000762220000, 0x0000000766660000)
  to   space 69888K,   0% used [0x0000000766660000, 0x0000000766660000, 0x000000076aaa0000)
 tenured generation   total 1398144K, used 1398096K [0x000000076aaa0000, 0x00000007c0000000, 0x00000007c0000000)
   the space 1398144K,  99% used [0x000000076aaa0000, 0x00000007bfff43d0, 0x00000007bfff4400, 0x00000007c0000000)
 Metaspace       used 3174K, capacity 4486K, committed 4864K, reserved 1056768K
  class space    used 354K, capacity 386K, committed 512K, reserved 1048576K
输出应用运行和暂停时间「-XX:+PrintGCDetails」
java -jar -Xms2g -Xmx2g -Xss256k -XX:+UseSerialGC -Xloggc:./log/SerialGC.log -Xloggc:./log/SerialGC.log -XX:+PrintGC -XX:+PrintGCTimeStamps -XX:+PrintGCDateStamps -XX:+PrintGCDetails -XX:+PrintGCApplicationStoppedTime -XX:+PrintGCApplicationConcurrentTime build/libs/tuning-1.0.jar
Java HotSpot(TM) 64-Bit Server VM (25.131-b11) for bsd-amd64 JRE (1.8.0_131-b11), built on Mar 15 2017 01:32:22 by "java_re" with gcc 4.2.1 (Based on Apple Inc. build 5658) (LLVM build 2336.11.00)
Memory: 4k page, physical 8388608k(897492k free)

/proc/meminfo:

CommandLine flags: -XX:InitialHeapSize=2147483648 -XX:MaxHeapSize=2147483648 -XX:+PrintGC -XX:+PrintGCApplicationConcurrentTime -XX:+PrintGCApplicationStoppedTime -XX:+PrintGCDateStamps -XX:+PrintGCDetails -XX:+PrintGCTimeStamps -XX:ThreadStackSize=256 -XX:+UseCompressedClassPointers -XX:+UseCompressedOops -XX:+UseSerialGC
2017-07-27T14:05:34.759-0800: 2.153: Application time: 2.0478404 seconds
2017-07-27T14:05:34.759-0800: 2.154: [GC (Allocation Failure) 2017-07-27T14:05:34.759-0800: 2.154: [DefNew: 559232K->69888K(629120K), 0.5654366 secs] 559232K->527812K(2027264K), 0.5655721 secs] [Times: user=0.19 sys=0.30, real=0.57 secs]
2017-07-27T14:05:35.325-0800: 2.719: Total time for which application threads were stopped: 0.5657692 seconds, Stopping threads took: 0.0000187 seconds
2017-07-27T14:05:36.329-0800: 3.723: Application time: 1.0042211 seconds
2017-07-27T14:05:36.329-0800: 3.724: Total time for which application threads were stopped: 0.0001244 seconds, Stopping threads took: 0.0000391 seconds
2017-07-27T14:05:36.760-0800: 4.154: Application time: 0.4309279 seconds
2017-07-27T14:05:36.760-0800: 4.155: Total time for which application threads were stopped: 0.0001497 seconds, Stopping threads took: 0.0000284 seconds
2017-07-27T14:05:36.950-0800: 4.345: Application time: 0.1900132 seconds
2017-07-27T14:05:36.951-0800: 4.345: [GC (Allocation Failure) 2017-07-27T14:05:36.951-0800: 4.345: [DefNew: 629120K->69862K(629120K), 0.8846757 secs] 1087044K->1082287K(2027264K), 0.8848374 secs] [Times: user=0.26 sys=0.46, real=0.88 secs]
2017-07-27T14:05:37.836-0800: 5.230: Total time for which application threads were stopped: 0.8852613 seconds, Stopping threads took: 0.0000832 seconds
2017-07-27T14:05:38.839-0800: 6.233: Application time: 1.0032695 seconds
2017-07-27T14:05:38.840-0800: 6.234: Total time for which application threads were stopped: 0.0005018 seconds, Stopping threads took: 0.0001292 seconds
2017-07-27T14:05:39.051-0800: 6.445: Application time: 0.2115884 seconds
2017-07-27T14:05:39.051-0800: 6.445: [GC (Allocation Failure) 2017-07-27T14:05:39.051-0800: 6.445: [DefNew: 629025K->629025K(629120K), 0.0000269 secs]2017-07-27T14:05:39.051-0800: 6.445: [Tenured: 1012424K->1352301K(1398144K), 2.6268730 secs] 1641449K->1352301K(2027264K), [Metaspace: 3144K->3144K(1056768K)], 2.6288018 secs] [Times: user=0.54 sys=1.11, real=2.63 secs]
2017-07-27T14:05:41.680-0800: 9.074: Total time for which application threads were stopped: 2.6289971 seconds, Stopping threads took: 0.0000277 seconds
2017-07-27T14:05:41.802-0800: 9.196: Application time: 0.1219801 seconds
2017-07-27T14:05:41.802-0800: 9.196: [GC (Allocation Failure) 2017-07-27T14:05:41.802-0800: 9.196: [DefNew: 559232K->559232K(629120K), 0.0000314 secs]2017-07-27T14:05:41.803-0800: 9.197: [Tenured: 1352301K->1398038K(1398144K), 0.6616166 secs] 1911533K->1490617K(2027264K), [Metaspace: 3144K->3144K(1056768K)], 0.6617623 secs] [Times: user=0.55 sys=0.04, real=0.66 secs]
2017-07-27T14:05:42.464-0800: 9.858: Total time for which application threads were stopped: 0.6619496 seconds, Stopping threads took: 0.0000255 seconds
2017-07-27T14:05:43.352-0800: 10.745: Application time: 0.8872496 seconds
2017-07-27T14:05:43.352-0800: 10.746: [Full GC (Allocation Failure) 2017-07-27T14:05:43.352-0800: 10.746: [Tenured: 1398141K->1398101K(1398144K), 1.7911804 secs] 2027220K->1569289K(2027264K), [Metaspace: 3145K->3145K(1056768K)], 1.7913125 secs] [Times: user=0.65 sys=0.01, real=1.79 secs]
2017-07-27T14:05:45.143-0800: 12.537: Total time for which application threads were stopped: 1.7915490 seconds, Stopping threads took: 0.0000303 seconds
2017-07-27T14:05:45.255-0800: 12.649: Application time: 0.1116887 seconds
2017-07-27T14:05:45.255-0800: 12.649: [Full GC (Allocation Failure) 2017-07-27T14:05:45.255-0800: 12.649: [Tenured: 1398101K->1398133K(1398144K), 2.0538765 secs] 2027178K->1669882K(2027264K), [Metaspace: 3145K->3145K(1056768K)], 2.0547590 secs] [Times: user=0.68 sys=0.02, real=2.06 secs]
2017-07-27T14:05:47.310-0800: 14.704: Total time for which application threads were stopped: 2.0549854 seconds, Stopping threads took: 0.0000326 seconds
2017-07-27T14:05:47.400-0800: 14.794: Application time: 0.0901190 seconds
2017-07-27T14:05:47.400-0800: 14.794: [Full GC (Allocation Failure) 2017-07-27T14:05:47.400-0800: 14.794: [Tenured: 1398133K->1398084K(1398144K), 0.7861572 secs] 2027209K->1777442K(2027264K), [Metaspace: 3155K->3155K(1056768K)], 0.7862706 secs] [Times: user=0.56 sys=0.01, real=0.78 secs]
2017-07-27T14:05:48.187-0800: 15.580: Total time for which application threads were stopped: 0.7864612 seconds, Stopping threads took: 0.0000295 seconds
Heap
 def new generation   total 629120K, used 417037K [0x0000000740000000, 0x000000076aaa0000, 0x000000076aaa0000)
  eden space 559232K,  74% used [0x0000000740000000, 0x00000007597434a0, 0x0000000762220000)
  from space 69888K,   0% used [0x0000000762220000, 0x0000000762220000, 0x0000000766660000)
  to   space 69888K,   0% used [0x0000000766660000, 0x0000000766660000, 0x000000076aaa0000)
 tenured generation   total 1398144K, used 1398084K [0x000000076aaa0000, 0x00000007c0000000, 0x00000007c0000000)
   the space 1398144K,  99% used [0x000000076aaa0000, 0x00000007bfff13e8, 0x00000007bfff1400, 0x00000007c0000000)
 Metaspace       used 3171K, capacity 4486K, committed 4864K, reserved 1056768K
  class space    used 354K, capacity 386K, committed 512K, reserved 1048576K
2017-07-27T14:05:48.193-0800: 15.587: Application time: 0.0066466 seconds
- GC 开销太大。如果 GC 暂停的总时间很长,就会损害系统的吞吐量。不同的系统允许不同比例的 GC 开销,但一般认为,正常范围在 10% 以内
- 极个别的 GC 事件暂停时间过长。当某次 GC 暂停时间太长,就会影响系统的延迟指标。如果延迟指标规定交易必须在 1,000 ms 内完成,那就不能容忍任何超过 1000 ms 的 GC 暂停
- 老年代的使用量超过限制。如果老年代空间在 Full GC 之后仍然接近全满,那么 GC 就成为了性能瓶颈,可能是内存太小,也可能是存在内存泄漏。这种症状会让 GC 的开销暴增