karyoploteR
 karyoploteR copied to clipboard
Capture Karyoplots as a grob to allow combining with other grid graphics objects in composite plots
I haven't been able to figure out how to convert / capture KaryoPlot objects as grobs which is a feature that would be very useful for creating composite plots.
Hi @RichardJActon
karyoploteR uses base graphics and mimics its behavior in that it does not produce a grapgics object where you set all parameters and then plot it all at the end but each function modifies the active graphical device and you build your plot iteratively.
Having said that, if you want to use karyoploteR plots in multipanel figures you can use the nifty CRAN package ggplotify (https://cran.r-project.org/web/packages/ggplotify/vignettes/ggplotify.html). It will take care of encapsulating the karyoploteR calls into grid or ggplot objects and make them compatible with grid, cowplot or patchwork. You'll need to put all your karyoploteR calls as parameter to expression or build a function with all the plotting code.
As an example (based on ggplotify vignette):
With ggplot
library(karyoploteR)
library(ggplotify)
pp <- getDefaultPlotParams(1)
pp$topmargin <- 500
library(cowplot)
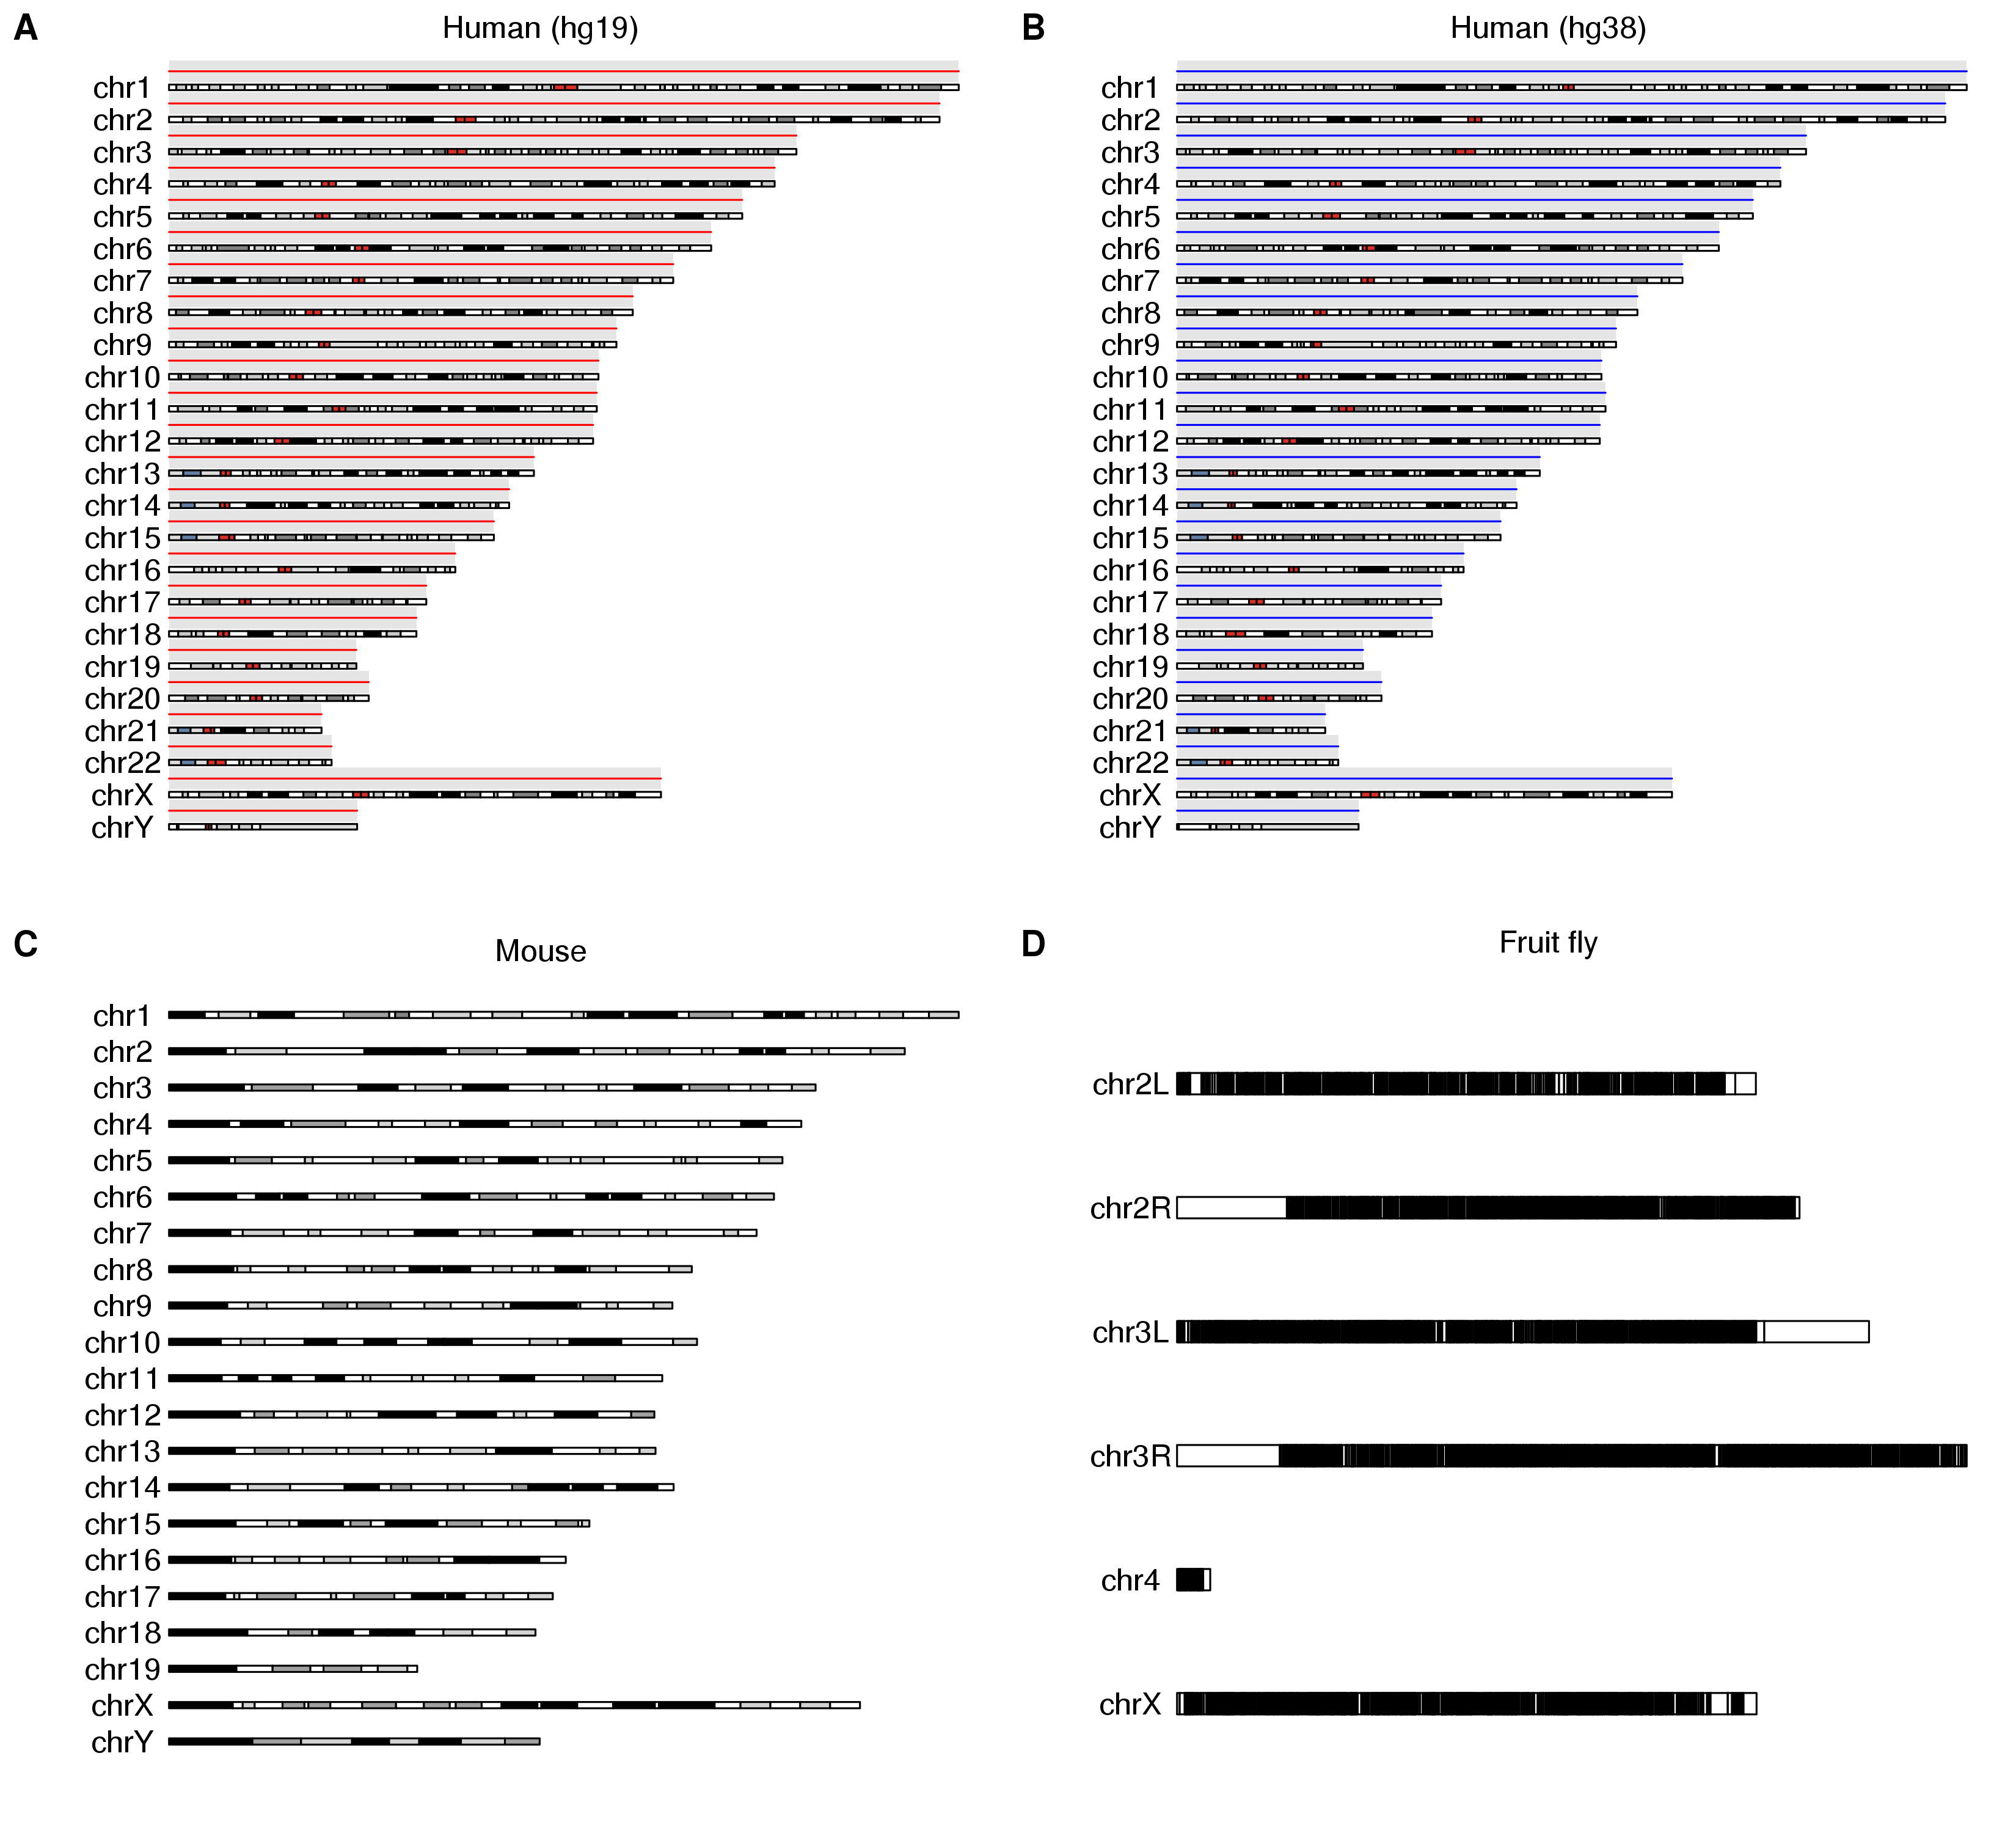
p1 <- as.ggplot(expression(kp <- plotKaryotype(main="Human (hg19)", plot.params = pp), kpDataBackground(kp), kpAbline(kp, h=0.5, col="red")))
p2 <- as.ggplot(expression(kp <- plotKaryotype(genome="hg38", main="Human (hg38)", plot.params = pp), kpDataBackground(kp), kpAbline(kp, h=0.5, col="blue")))
p3 <- as.ggplot(expression(plotKaryotype(genome = "mm10", main="Mouse", plot.params = pp)))
p4 <- as.ggplot(expression(plotKaryotype(genome = "dm6", main="Fruit fly")))
save_plot("Multipanel_cowplot.png", plot_grid(p1, p2, p3, p4, ncol=2, labels=LETTERS[1:9]), base_height=10)
With grid
library(grid)
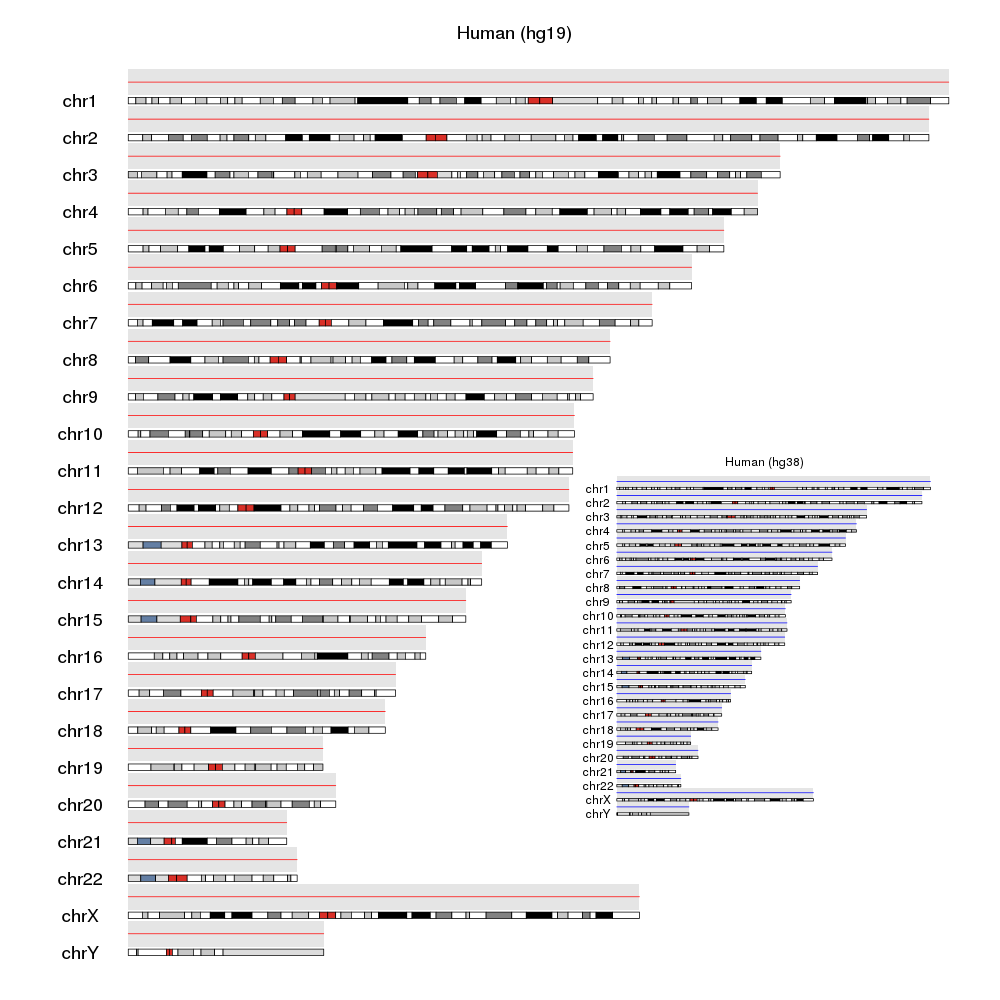
p1 <- as.grob(expression(kp <- plotKaryotype(main="Human (hg19)", plot.params = pp, cex=1.5), kpDataBackground(kp), kpAbline(kp, h=0.5, col="red")))
p2 <- as.grob(expression(kp <- plotKaryotype(genome="hg38", main="Human (hg38)", plot.params = pp), kpDataBackground(kp), kpAbline(kp, h=0.5, col="blue")))
png("Multipanel_grid.png", width=1000, height=1000)
grid.newpage()
grid.draw(p1)
vp = viewport(x=.75, y=.35, width=.4, height=.4)
pushViewport(vp)
grid.draw(p2)
upViewport()
dev.off()
Hope this helps
Bernat
Hi @bernatgel Thanks a lot for the help. I think I was just missing wrapping the call to plotKaryotype() in expression() before trying to convert it to a grob/ggplot object!
Glad it worked :)
On Thu, Sep 5, 2019 at 7:07 PM Richard James Acton [email protected] wrote:
Hi @bernatgel https://github.com/bernatgel Thanks a lot for the help. I think I was just missing wrapping the call to plotKaryotype() in expression() before trying to convert it to a grob/ggplot object!
— You are receiving this because you were mentioned. Reply to this email directly, view it on GitHub https://github.com/bernatgel/karyoploteR/issues/51?email_source=notifications&email_token=AAHAPQI3TZRUTY2IR2DM62LQIE4GZA5CNFSM4ITUPIGKYY3PNVWWK3TUL52HS4DFVREXG43VMVBW63LNMVXHJKTDN5WW2ZLOORPWSZGOD5763TY#issuecomment-528477647, or mute the thread https://github.com/notifications/unsubscribe-auth/AAHAPQNBESPXFG5FLB7NUIDQIE4GZANCNFSM4ITUPIGA .
Hi @bernatgel, I hope it is ok if I reopen this closed issue. Thanks for the tip above, I found it very useful. I am wondering whether you have tried ggplotify on a karyoploteR call that includes kpPlotGenes? My attempts are giving me the following error.
Error in UseMethod("validGrob") :
  no applicable method for 'validGrob' applied to an object of class "NULL"
In addition: Warning messages:
1: In editThisGrob(grob, specs) : slot 'vp' not found
2: In editThisGrob(grob, specs) : slot 'name' not found
Hi @repeatpipettor
I cannot reproduce the error.
Mixing the example above with the example code in kpPlotGenes it just works.
library(karyoploteR)
library(ggplotify)

pp <- getDefaultPlotParams(1)
pp$topmargin <- 500

library(cowplot)
  p1 <- as.ggplot(expression(kp <- plotKaryotype(main="Human (hg19)", plot.params = pp), kpDataBackground(kp), kpAbline(kp, h=0.5, col="red")))
  p2 <- as.ggplot(expression(kp <- plotKaryotype(genome="hg38", main="Human (hg38)",  plot.params = pp), kpDataBackground(kp), kpAbline(kp, h=0.5, col="blue")))
  p3 <- as.ggplot(expression(plotKaryotype(genome = "mm10", main="Mouse", plot.params = pp)))
  p4 <- as.ggplot(expression(plotKaryotype(genome = "dm6", main="Fruit fly")))
  save_plot("Multipanel_cowplot.png", plot_grid(p1, p2, p3, p4, ncol=2, labels=LETTERS[1:9]), base_height=10)

What versions are you using? Can you create a tiny example failing for you and post the code and the output from sessionInfo() into a new issue so I can try to see what's going on?
Bernat
Hi @repeatpipettor and @bernatgel
Did you manage to solve the error? I am having the same issue with plotKaryotype and kpPlotBAMCoverage. See me code and sesionInfo() below.
Thanks in advance, Victoria
`p1<- as.ggplot(expression(kp<- plotKaryotype(genome=info, plot.type = 1, chromosomes = c("1","2","2"), main="Genome 1", plot.params = pp), kpAddBaseNumbers(kp, tick.dist = 1000000, add.units = TRUE), pPlotBAMCoverage(kp, data="bam1.bam", max.valid.region.size = 2e16, border = "black",lwd=2, r0=0.5, r1=1), kpAxis(kp, ymax=kp$latest.plot$computed.values$max.coverage, r0=0.5, r1=1), kpAddLabels(kp, "WT", r0=0.5, r1=1, label.margin = 0.05), kpPlotBAMCoverage(kp, data="bam2.bam", max.valid.region.size = 2e16, border="orange",lwd=2, r0=0.5, r1=0),kpAxis(kp, ymax=kp$latest.plot$computed.values$max.coverage, r0=0.5, r1=0),kpAddLabels(kp, "R6", r0=0.5, r1=0, label.margin = 0.05)))
p2 <- as.ggplot(expression(kp<- plotKaryotype(genome=info2, plot.type = 1,chromosomes = c("1","2","3"),main= "Genome 2",plot.params = pp), kpAddBaseNumbers(kp, tick.dist = 1000000, add.units = TRUE), kpPlotBAMCoverage(kp, data="bam1B.bam", max.valid.region.size = 2e16, border="black",lwd=2, r0=0.5, r1=1), kpAxis(kp, ymax=kp$latest.plot$computed.values$max.coverage, r0=0.5, r1=1),kpAddLabels(kp, "WT", r0=0, r1=0.5, label.margin = 0.05), kpPlotBAMCoverage(kp, data="bam2M.bam", max.valid.region.size = 2e16, border="orange",lwd=2, r0=0.5, r1=0), kpAxis(kp, ymax=kp$latest.plot$computed.values$max.coverage, r0=0.5, r1=0), kpAddLabels(kp, "R6", r0=0.5, r1=1, label.margin = 0.05)))
save_plot("Multipanel_cowplot.png", plot_grid(p1,p2, ncol=2), base_height = 20)
Error in UseMethod("validGrob") : no applicable method for 'validGrob' applied to an object of class "NULL" In addition: Warning messages: 1: In editThisGrob(grob, specs) : slot 'vp' not found 2: In editThisGrob(grob, specs) : slot 'name' not found `
`sessionInfo() R version 4.1.2 (2021-11-01) Platform: x86_64-w64-mingw32/x64 (64-bit) Running under: Windows 10 x64 (build 22000)
Matrix products: default
locale:
[1] LC_COLLATE=Spanish_Spain.1252 LC_CTYPE=Spanish_Spain.1252 LC_MONETARY=Spanish_Spain.1252
[4] LC_NUMERIC=C LC_TIME=Spanish_Spain.1252
system code page: 65001
attached base packages: [1] stats4 stats graphics grDevices utils datasets methods base
other attached packages:
[1] ggplotify_0.1.0 cowplot_1.1.1 karyoploteR_1.20.3 regioneR_1.26.1 GenomicRanges_1.46.1
[6] GenomeInfoDb_1.30.1 IRanges_2.28.0 S4Vectors_0.32.3 BiocGenerics_0.40.0 valr_0.6.4
[11] tximport_1.22.0 data.table_1.14.2 skimr_2.1.3 janitor_2.1.0 here_1.0.1
[16] forcats_0.5.1 stringr_1.4.0 dplyr_1.0.8 purrr_0.3.4 readr_2.1.2
[21] tidyr_1.2.0 tibble_3.1.6 ggplot2_3.3.5 tidyverse_1.3.1 ....
`
Hi @mvapontes
I think your problem here is a typo. Have you tried to run the karyoploteR code by itself out of the expression and as.ggplot?
I've copied the code you included in you comment and you are missing a "k" in the first call to kpPlotBAMCoverage and this will produce an error which could not create a valid plot and that could create the error you are seeing. This is much more clear if you expand your code like this (it's the third karyoploteR call in p1.
library(karyoploteR)
library(ggplotify)

p1<- as.ggplot(
  expression(
    kp<- plotKaryotype(genome=info, plot.type = 1, chromosomes = c("1","2","2"), main="Genome 1", plot.params = pp),
    kpAddBaseNumbers(kp, tick.dist = 1000000, add.units = TRUE),
    pPlotBAMCoverage(kp, data="bam1.bam", max.valid.region.size = 2e16, border = "black",lwd=2, r0=0.5, r1=1),
    kpAxis(kp, ymax=kp$latest.plot$computed.values$max.coverage, r0=0.5, r1=1),
    kpAddLabels(kp, "WT", r0=0.5, r1=1, label.margin = 0.05),
    kpPlotBAMCoverage(kp, data="bam2.bam", max.valid.region.size = 2e16, border="orange",lwd=2, r0=0.5, r1=0),
    kpAxis(kp, ymax=kp$latest.plot$computed.values$max.coverage, r0=0.5, r1=0),
    kpAddLabels(kp, "R6", r0=0.5, r1=0, label.margin = 0.05)
  )
)

p2 <- as.ggplot(
  expression(
    kp<- plotKaryotype(genome=info2, plot.type = 1,chromosomes = c("1","2","3"),main= "Genome 2",plot.params = pp),
    kpAddBaseNumbers(kp, tick.dist = 1000000, add.units = TRUE),
    kpPlotBAMCoverage(kp, data="bam1B.bam", max.valid.region.size = 2e16, border="black",lwd=2, r0=0.5, r1=1),
    kpAxis(kp, ymax=kp$latest.plot$computed.values$max.coverage, r0=0.5, r1=1),
    kpAddLabels(kp, "WT", r0=0, r1=0.5, label.margin = 0.05),
    kpPlotBAMCoverage(kp, data="bam2M.bam", max.valid.region.size = 2e16, border="orange",lwd=2, r0=0.5, r1=0),
    kpAxis(kp, ymax=kp$latest.plot$computed.values$max.coverage, r0=0.5, r1=0),
    kpAddLabels(kp, "R6", r0=0.5, r1=1, label.margin = 0.05)
  )
)

save_plot("Multipanel_cowplot.png", plot_grid(p1,p2, ncol=2), base_height = 20)
If you fix this and the error keeps appearing, could you generate a minimal and self-contained example I can try?
Hope this helps
Bernat
Hi @bernatgel !
Thanks! Unfortunately the typo is not the issue. I was just a bad copy-paste.
The code run fine outside expression and as.ggplot. I tried the example with expression and as.ggplot one chromosome per column and get the same error. I email you a small example.
algo <-data.table(RefSeq.Accn=c("NC_030986.1", "NC_030987.1"), start= c(1,1), end=c(6854980,5577357))

info<-GRanges(seqnames= Rle (algo$RefSeq.Accn), ranges=IRanges(start=algo$start, end=algo$end))

kp<- plotKaryotype(genome=info, plot.type = 1, chromosomes = c("NC_030986.1","NC_030987.1"))
kpAddBaseNumbers(kp, tick.dist = 1000000, add.units = TRUE)
kp<-kpPlotBAMCoverage(kp, data="E:/workingDirectory/RafaPalos/genome_mapping/B1.bam",  max.valid.region.size = 2e16, border="black",lwd=2, r0=0.5, r1=1)
kpAxis(kp, ymax=kp$latest.plot$computed.values$max.coverage, r0=0.5, r1=1)
kpAddLabels(kp, "WT",r0=0.5, r1=1, label.margin = 0.05)

kp<-kpPlotBAMCoverage(kp, data="E:/workingDirectory/RafaPalos/genome_mapping/B2.bam", max.valid.region.size = 2e16, border="orange",lwd=2, r0=0.5, r1=0)
kpAxis(kp, ymax=kp$latest.plot$computed.values$max.coverage, r0=0.5, r1=0)
kpAddLabels(kp, "R6", r0=0.5, r1=0, label.margin = 0.05)
Ok, I've downloaded the data and can reproduce the problem. With a human genome and my BAMs it works ok, but not with your genome and BAMs... I'll investigate to see why and get back to you.
Bernat
Hi @bernatgel ,
I was able to use your ggplotify solution to combine multiple plots. However, for some reason when I use it the axis labels (kpText, kpAxis, kpAddLabels) will only appear on the first chromosome/scaffold. Whereas if I generate the plots separately the labels appear correctly on all scaffolds. Do you have any guess on why this is happening?
p1 <- as.ggplot(expression(
  kp <- plotKaryotype(genome = genome_bed_gr, plot.type = 6, cex = 1,
                      plot.params = pp6, labels.plotter = NULL,
                      main = paste(i, "- BAF", sep = " ")),
  kpText(kp, chr = genome_bed$V1, x = -400000, y = 0.5,
         labels = genome_bed$V1, cex = 0.8, font = 2),
  kpAddBaseNumbers(kp, tick.dist = 1e6, add.units = T,
                   tick.len = 5, cex = 0.6),
  kpPlotRegions(kp, genome_bed_gr, col = "white",
                data.panel = 'ideogram', border = "black"),
  kpPlotRegions(kp, data = genome_bed_gr, col = "#b80000",
                r0 = 0.5, r1 = 0.5025),
  kpAxis(kp, tick.len = 40000, cex = 0.6, side = 1,
         label.margin = -40000, data.panel = "ideogram"),
  kpAddLabels(kp, labels = "BAF", srt=90, pos = 1,
              cex = 0.6, label.margin = 0.03),
  kpPoints(karyoplot = kp,
           chr = sample_snv$V1,
           x = sample_snv$V2,
           y = sample_snv$V6,
           cex = 0.18, col = mycol)

  ))

  p2 <- as.ggplot(expression(
    kp2 <- plotKaryotype(genome = genome_bed_gr, plot.type = 6, cex= 1.2,
                         plot.params = pp6, labels.plotter = NULL,
                         main = paste(i, "- Depth", sep = " ")),
    kpText(kp2, chr = genome_bed$V1, x = -400000, y = 0.5,
           labels = genome_bed$V1, cex = 0.8, font = 2),
    kpAddBaseNumbers(kp2, tick.dist = 1e6, add.units = T,
                     tick.len = 5, cex = 0.6),
    kpPlotRegions(kp2, genome_bed_gr, col = "white",
                  data.panel = 'ideogram', border = "black"),
    kpArea(kp2, chr = sample_depth$V1,
           x = sample_depth$V2,
           y = sample_depth$V3,
           ymin = 0, ymax = 70, r0 = 0, r1 = 1, lty = 1, lwd = 2,
           col = "mediumspringgreen", border = NA),
    kpAxis(kp2, ymin = 0, ymax = 75, r0 = 0, r1 = 1, cex = 0.6,
           label.margin = -45000, tick.pos = c(0,25,50,75), tick.len = 40000, data.panel = "ideogram"),
    kpAddLabels(kp2, labels = "Depth", srt=90, pos = 1,
                cex = 0.6, label.margin = 0.03)))

  save_plot(filename = paste(i, "_baf_depth.png", sep = ""),
            plot = plot_grid(p1, p2, nrow = 1), base_height = 14, base_width = 28)

Hi,
Do you have any idea on how to solve this one ? Thank you.
Ok, I've downloaded the data and can reproduce the problem. With a human genome and my BAMs it works ok, but not with your genome and BAMs... I'll investigate to see why and get back to you.
Bernat