seeing 100% cpu with very low throughput. It's impacting our production systems as well.
I think I'm seeing busy waiting loops in my profiler. I using gevent worker class in gunicorn for my django service, which has mysql and redis as well. So in my profiler, the cpu time for sleep function increases when there are about 10 to 12 requests on a 4 vCPU aws containers(2 containers with 2vCPU each)and the cpu goes to 100% and the response time also increases a lot. How can i increase my through. put please guide i'm stuck.

I'm not sure how to interpret those numbers, but I'll ask, why do you think you are getting low throughout? Are you seeing low throughout? High latencies? How many requests/sec? If the gevent hub is sleeping, that could be because it is idle a lot.
Also possible is that you're not using libraries compatible with gevent. What MySQL and Redis libraries are you using?
@tilgovi
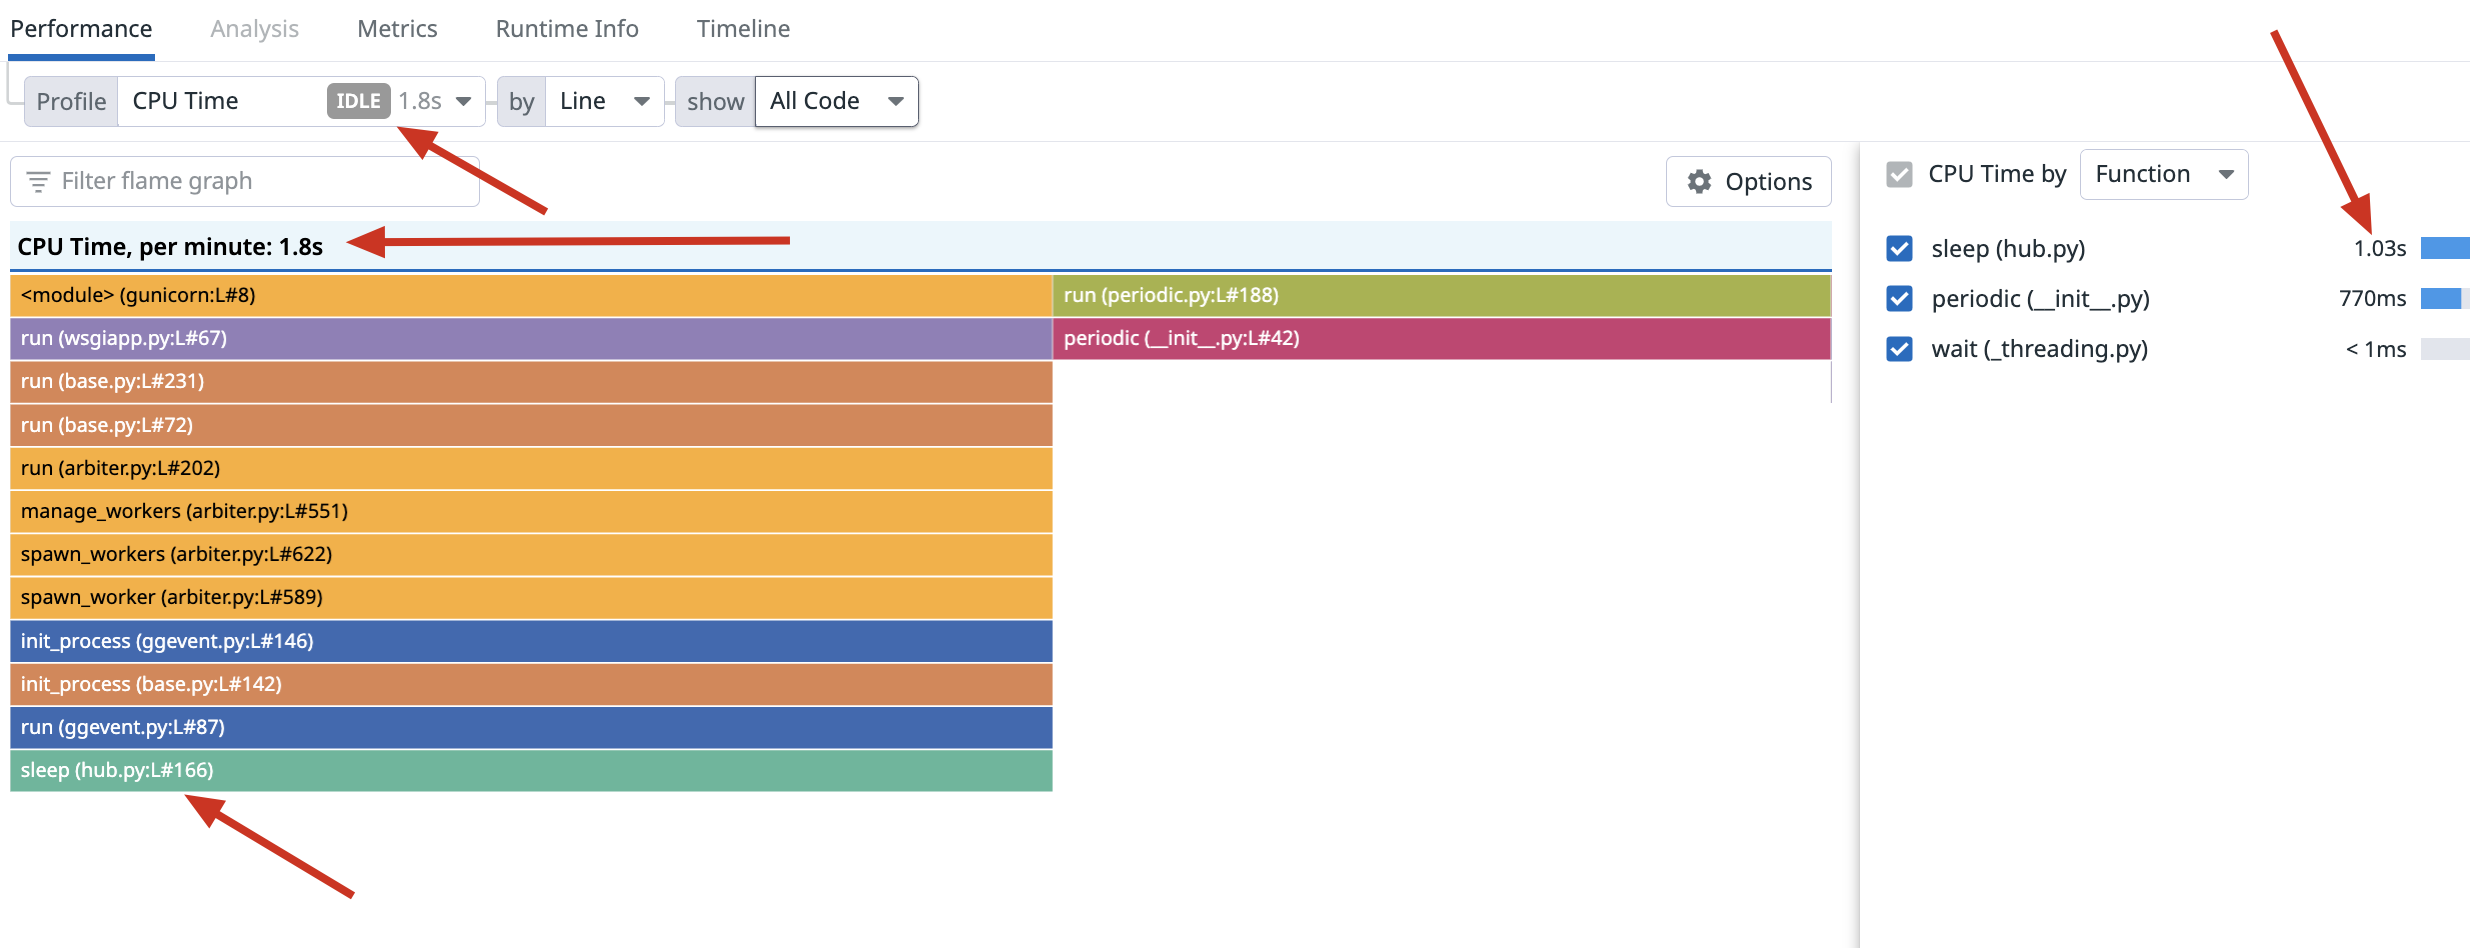
Here is a snapshot of a gunicorn process from a small test:
Infra: 2 aws ecs containers: (with 2vCPU and 6GB RAM each) gunicorn workers: 4(each container) worker class: gevent My command: gunicorn -n "testapp" --access-logfile gunicorn.access.log --error-logfile gunicorn.error.log --log-level 'debug' -w 4 --worker-connections=200 --reuse-port -k gevent -t 60 -b 0.0.0.0:8000 testapp.wsgi_prod:application
I started with 6 requests/sec at 12:30 and then increased it to 12 requests/sec at 12:45(u can see in the screenshot) so at 12:30, the total cpu utilization of two containers sky-rocketed to ~70% at 12:45, the total cpu utilization of two containers sky-rocketed to ~140%
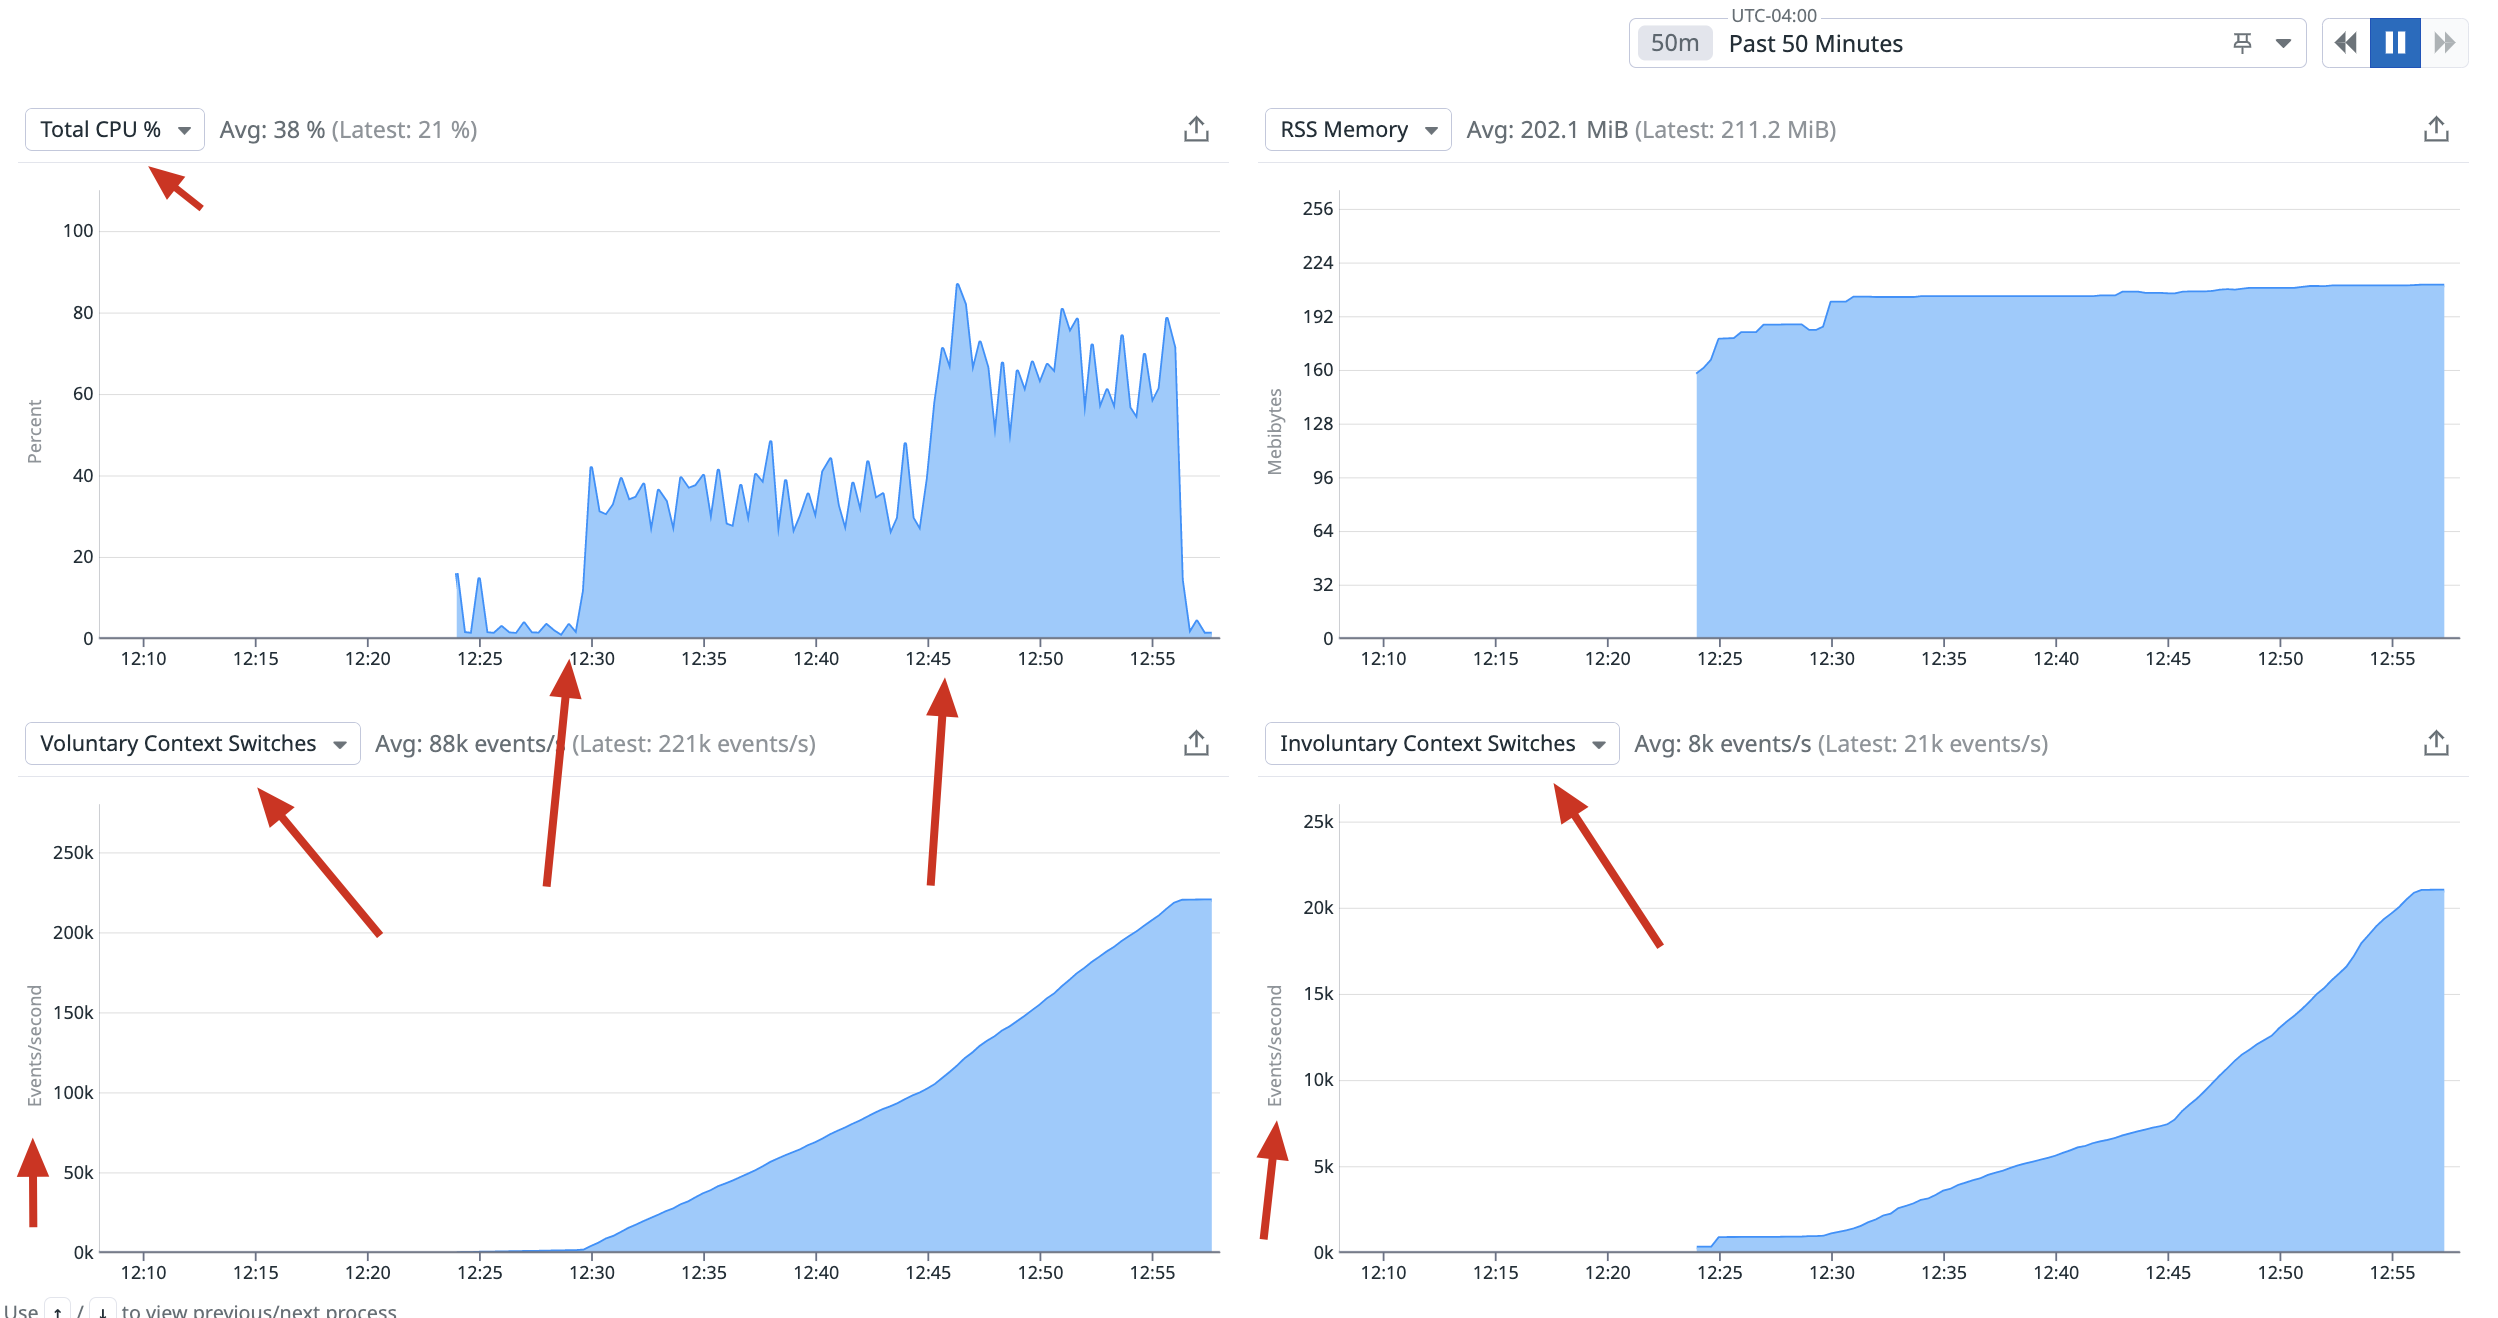
gevent hub is sleeping, that could be because it is idle a lot. If that's true, why CPU is going beyond 100% i'm not understanding. By low throughput I mean, 4vCPUs not able to handle even 15 requests/sec. Why so low request rate?
Here: gevent author mentioned in another cpu related issue that, we might be doing a lot of busy waiting loops (calls to sleep()) https://github.com/gevent/gevent/issues/1332#issuecomment-450369094
I'm using these libs: https://pypi.org/project/redis/ for redis(redis==3.5.3 ) pymysql==1.0.2
My entrypoint code:
import os import sys import pymysql pymysql.install_as_MySQLdb() from gevent import monkey
if name == "main":
monkey.patch_all()

os.environ.setdefault('ROOT_DIR', os.path.abspath(os.path.dirname(__file__)))
os.environ.setdefault("DJANGO_SETTINGS_MODULE", "testapp.settings")
from django.core.management import execute_from_command_line

print(f"Executing: {sys.argv}")
execute_from_command_line(sys.argv)
Plus, in my datadog profiler, I'm not seeing any cpu intensive functions(from my own code or django project) that's taking too much time apart from gevent sleep().
So not sure why the cpu is sky-rocketing with so less number of requests.
The file you posted as your entrypoint looks like a Django entrypoint, but how to you invoke gunicorn?
Also, you may need to monkey patch before you import other things. But gunicorn should do that for you, depending on how you are using it.
This is my gunicorn command that I'm running in each container:
gunicorn -n "testapp" --access-logfile gunicorn.access.log --error-logfile gunicorn.error.log --log-level 'debug' -w 4 --worker-connections=200 --reuse-port -k gevent -t 60 -b 0.0.0.0:8000 testapp.wsgi_prod:application
And I'm managing the gunicorn invocation and process using supervisord and mentioning the above gunicorn command in supervisord.conf
Also, i have nginx as well sitting in front for gunicorn server
@alok2k5ingh Any update on this issue? Did you find any solution. Seems like I am also facing similar issue.
Facing similar issue, but only with some workers (1-2 out of 9 and growing).
Profiled them with cProfile.
Here is "normal" worker profile.
And here is profile of workers that that have 100% cpu usage.