Declining multithreading performance on decent dual AMD Epyc 7643 server
Dear All,
I would like to share some interesting observations about Diamond's performance on a fairly powerful AMD Epyc based server comparing to an older one. Interestingly, as I increase the thread count on the new system the performance decreases and even in 32 threads mode I can't reach the speed of the older system.
version: diamond v2.0.14.152 CLI: ./diamond blastx -d NR -q N65-111_dedup.fa -o N65-111 --threads (32) (64) (188) -f 100 -c1 -b20 --un N65-dark-111.fa
Reference system: (Ubuntu 20.04.3 LTS) 2 x AMD EPYC 7282 - 1,5 GHz / 2,8 GHz (Boost) 64 threads 384Gb RAM Total time = 5075.2s
Decent system: (Ubuntu 21.10) 2 x AMD EPYC 7643 - 2,30 GHz / 3,6 GHz (Boost) 188 threads 1Tb RAM Total time = 6979.27s
2 x AMD EPYC 7643 - 2,30 GHz / 3,6 GHz (Boost) 64 threads 1Tb RAM Total time = 5638.73s
2 x AMD EPYC 7643 - 2,30 GHz / 3,6 GHz (Boost) 32 threads 1Tb RAM Total time = 5555.9s
Reported 33332955 pairwise alignments, 33332955 HSPs. 2305437 queries aligned.
- Database: NR.dmnd (type: Diamond database, sequences: 458431797, letters: 174524903011)
- N65-111_dedup.fa is a metagenomic readset with trimmed 4297335 sequences (lenghts: 80-190nt)
- Scoring parameters: (Matrix=BLOSUM62 Lambda=0.267 K=0.041 Penalties=11/1)
- Target sequences to report alignments for: 25
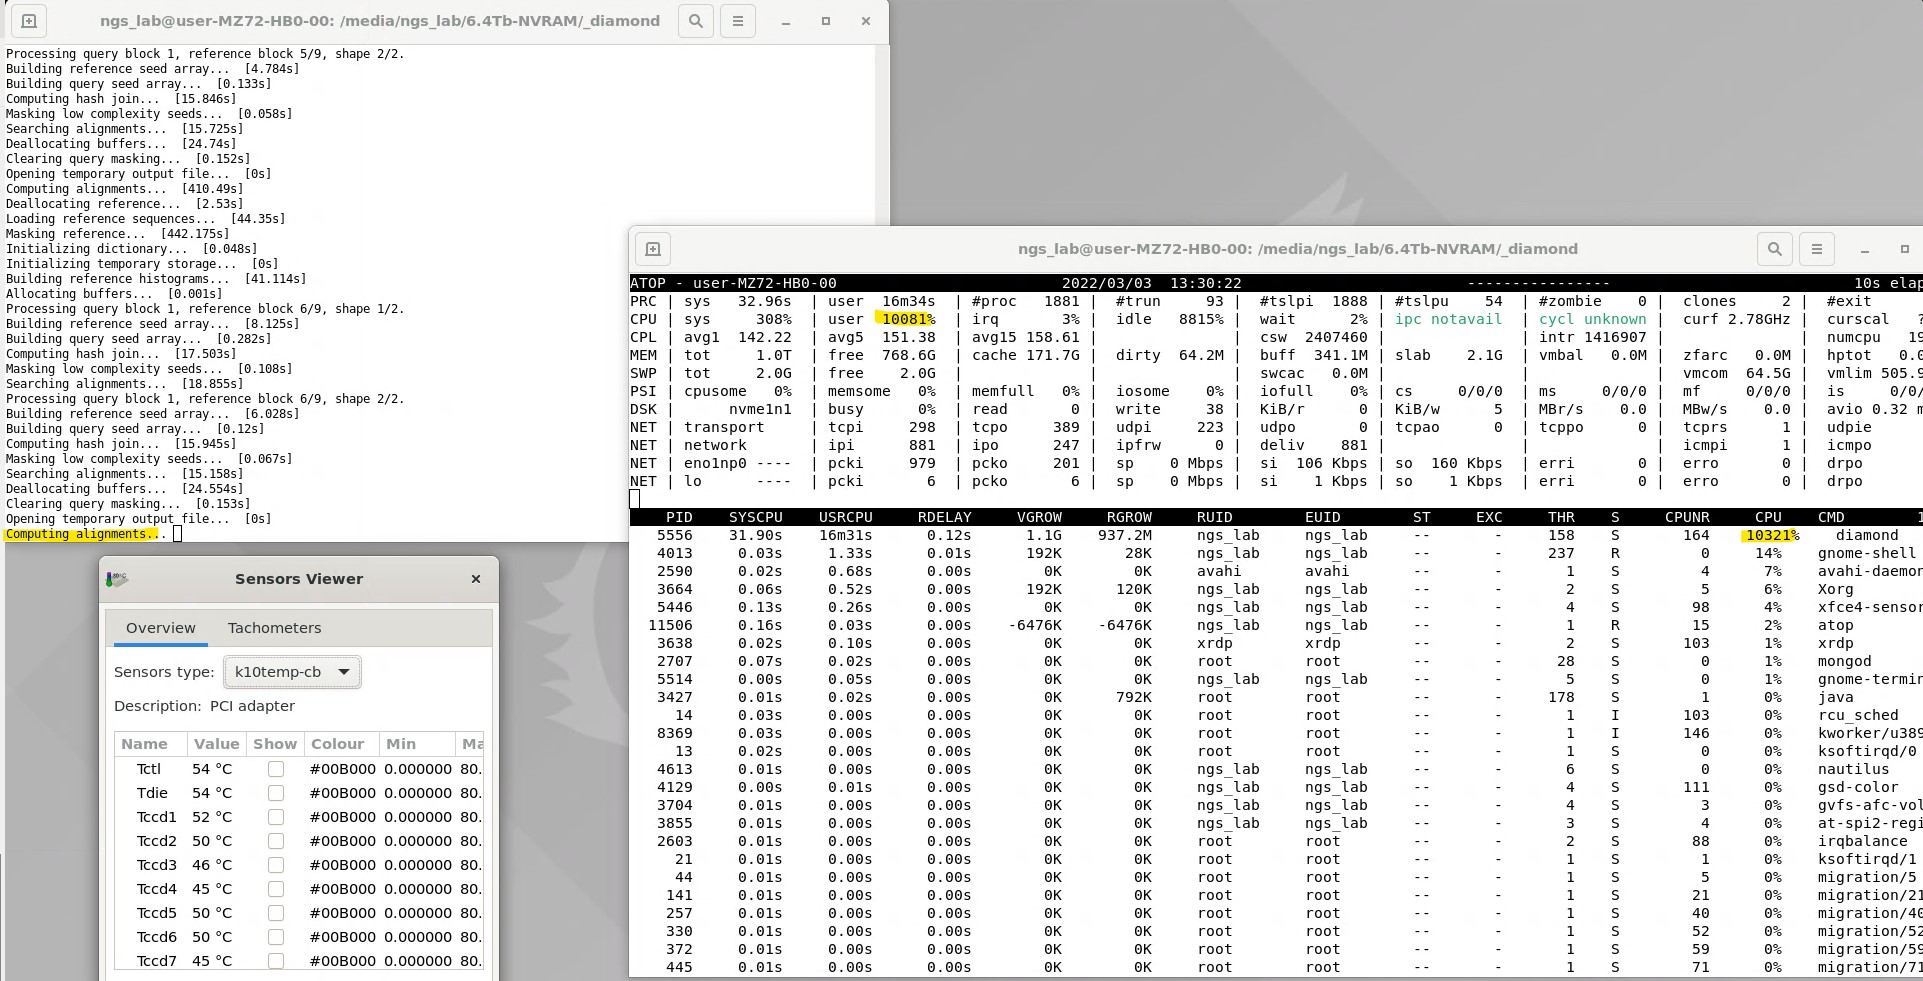
In particular, the following operations slow down as the thread count increases: Masking reference, Building reference histograms, Computing alignments.
Thank you in advance for all comments and suggestions!
More detailed information in the attachment:
Diamond_benchmark_AMD_Epyc_platforms.pdf
I have seen the same effect on our EPYC systems but the reason is not clear to me. All cores seem to be running at max with no obvious bottlenecks like synchronization or I/O. Have you tested other tools with respect to this?
So far I'm only testing the Diamond, but all I/O systems are working fine and at full benchmarked speed (Gigabyte MZ72-HB0 MB, 4+6Tb Ultra-Fast M.2 with PCIe Gen4, 3200MHz RDIMM DDR4 RAM). I'm not sure but the clock speeds seem to increase a little bit slowly, even though the governor is set to performance state and the CPU cycles would have an affinity towards higher clock limit. (Normal BIOS profile, boost on) I plan to check it more deeply with the Atop util.
Clock speeds are good, this issue is clarified. An example: . . CPU154: 99.0% 3450 MHz CPU155: 0.0% 2300 MHz CPU156: 99.0% 3450 MHz CPU157: 0.0% 2300 MHz CPU158: 99.0% 3450 MHz CPU159: 100.0% 3450 MHz CPU160: 0.0% 2300 MHz CPU161: 100.0% 3450 MHz CPU162: 0.0% 2300 MHz CPU163: 0.0% 2300 MHz CPU164: 99.0% 3450 MHz CPU165: 0.0% 2300 MHz CPU166: 0.0% 2300 MHz CPU167: 100.0% 3450 MHz CPU168: 100.0% 3450 MHz CPU169: 100.0% 3450 MHz CPU170: 0.0% 2300 MHz CPU171: 0.0% 2300 MHz CPU172: 0.0% 2300 MHz CPU173: 0.0% 2300 MHz CPU174: 0.0% 2300 MHz CPU175: 100.0% 3450 MHz CPU176: 100.0% 3450 MHz CPU177: 100.0% 3450 MHz CPU178: 0.0% 2300 MHz CPU179: 0.0% 2300 MHz CPU180: 99.0% 3450 MHz CPU181: 0.0% 2300 MHz CPU182: 100.0% 3450 MHz CPU183: 63.7% 3450 MHz CPU184: 0.0% 2300 MHz CPU185: 0.0% 2300 MHz CPU186: 4.0% 2300 MHz CPU187: 82.0% 2300 MHz CPU188: 8.9% 2300 MHz CPU189: 2.0% 2300 MHz CPU190: 78.8% 3450 MHz CPU191: 100.0% 3450 MHz
---------------------------- CPU frequency scaling ----------------------------
Currently using: performance governor Suggesting use of "performance" governor
Total CPU usage: 46.9 % Total system load: 83.68
High CPU load suggesting to set turbo boost: on Currently turbo boost is: on
Also Matlab suffers similar issues, running Diamond in forced AVX2 mode is could be a solution?
echo 'export MKL_DEBUG_CPU_TYPE=5' >> ~/.profile
https://www.reddit.com/r/matlab/comments/dxn38s/howto_force_matlab_to_use_a_fast_codepath_on_amd/
Diamond does not use the MKL library so this will have no effect. It does use AVX2 also on EPYC systems. I will have to look into this more closely when I find the time although I'm not sure at the moment if this is an issue with Diamond in particular.
I have tested this on one of our 128-core EPYC servers using another tool (mmseqs2), searching 1 million proteins against the UniRef50 at sensitivity -s3. Timing for identical runs using 32, 64, 128 and 256 threads:
84914.61user 100.35system 45:10.67elapsed 3136%CPU (0avgtext+0avgdata 117736840maxresident)k
0inputs+0outputs (0major+2016377minor)pagefaults 0swaps

100912.77user 42.49system 26:59.27elapsed 6234%CPU (0avgtext+0avgdata 135396212maxresident)k
0inputs+0outputs (0major+2092584minor)pagefaults 0swaps

202404.63user 135.66system 27:00.98elapsed 12494%CPU (0avgtext+0avgdata 170699896maxresident)k
0inputs+0outputs (0major+2294845minor)pagefaults 0swaps

388260.78user 523.95system 27:48.37elapsed 23303%CPU (0avgtext+0avgdata 220683568maxresident)k
0inputs+0outputs (0major+5190332minor)pagefaults 0swaps
Identical times for 64 and 128 threads certainly looks questionable to me, so I'm still not sure if this is a Diamond-specific issue or not.
Dear Benjamin,
Thank you for the new additions! May I ask which linux distribution is running on that server? We chose the latest Ubuntu because it is traditionally one of the best that supports the Zen3 architecture / latest drivers (at least according to the brochures). I see that Diamond and mmseqs2 are both mainly C/C++ based, is it possible that this fact has something to do with the phenomenon? Other applications e.g. CLC mapper, bowtie2 work at full speed. However, there are performance related problems with e.g. the Geneious mapper algorithm on older Zen2 based servers, too. Biomatters' developers wrote: "There is a bottleneck in collating the results from different CPUs which appears to be worse on Linux compared to other platforms. It's most noticeable when you have high throughput in terms of the number of reads processed per second, so in your case where you have 64 CPUs it can process a lot very quickly and hits the bottleneck more easily."
Bests: B
Our server runs Ubuntu 18.04. No I don't see how this should be caused by the C++ language.
Thanks, it seems then that this is a common issue, regardless of Ubuntu versions. What I've also noticed is that the "computing alignments phase" has a drop in CPU usage, never going above 80-120 threads. Also building ref. histos and masking using all of the threads, despite this I experience long computation times as wrote earlier. (The C++ issue can really be ruled out, it was a bad idea)
One more important piece of information: recompiling natively with latest AOCC 3.2 ( https://developer.amd.com/amd-aocc/ ) did not lead to great achievement, benchmark results coming soon :(
I did some more testing and I can confirm that there is suboptimal core utilization for short read alignment when using 256 threads. I will work on improving this. For now you can get better efficiency by running multiple datasets in parallel with less threads.
Thank you for advance. Indeed, we are running 4 diamond copies (4*32 threads) parallel, until the improvement arrives.
An interesting article: maybe we should wait for linux kernel 5.18? (Benchmarking The AMD EPYC Speed Boost Coming To Linux 5.18, Thanks To Scheduler/NUMA Improvement) Mel Gorman. The author of the new AMD patch explains in further detail: "A kernel scheduler change from 2020] allowed an imbalance between NUMA nodes such that communicating tasks would not be pulled apart by the load balancer. This works fine when there is a 1:1 relationship between LLC and node but can be suboptimal for multiple LLCs if independent tasks use CPUs sharing cache. Zen* has multiple LLCs per node with local memory channels, and due to the allowed imbalance, it's far harder to tune some workloads to run optimally than it is on hardware with 1 LLC per node. This patch allows an imbalance to exist up to the point where LLCs should be balanced between nodes."
- https://www.phoronix.com/scan.php?page=article&item=linux-imbalance-epyc&num=1
- https://wccftech.com/amd-epyc-gets-performance-boost-in-linux-5-18-improvements-to-scheduler-numa-benchmarked/