snestracker
 snestracker copied to clipboard
[Feature request] Add a colour key to the debugger 🎨
The debugger has a gorgeous visual representation of memory usage, but doesn't have a corresponding key to tell users what the different coloured sections represent. Let's add a key onto that page in the Debugger, so it is no longer a mystery.
What the different colours mean has already been documented here by Bazz: https://github.com/bazzinotti/snestracker/wiki/Debugger
They are:
-
RED: PC (program counter) execution addresses.
-
BLUE: Reads
- ️WHITE DOTS: BRR sample header bytes
-
YELLOW: End BRR block
-
GREEN: Writes.
-
CYAN: Read+Write
-
-
BLACK: Free memory?
Assign this to me if you like and I will design how the key can fit nicely into the debugger window.
oops lol this a dupe of https://github.com/bazzinotti/snestracker/issues/85
Yes. 😂
But it is easy to differentiate between the yellow echo region and yellow BRR end blocks. BRR End blocks come at the end of BRR samples, which are easy to identify from their 9-byte repetitive diagonal patterns of white (brr header byte) and blue (read).
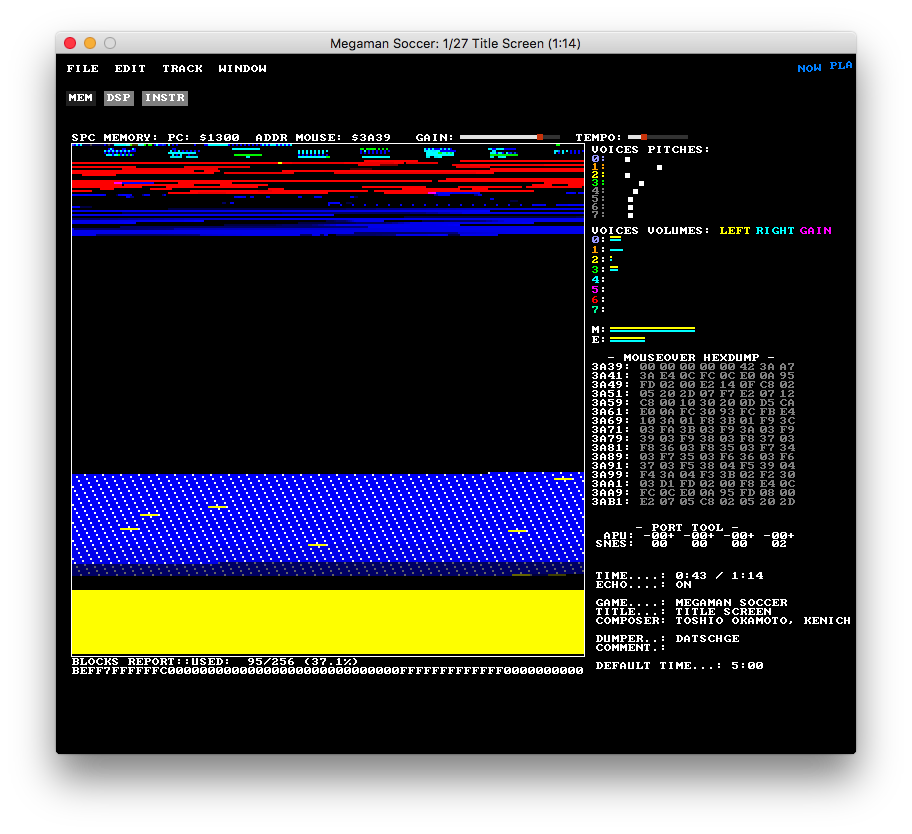
In the picture, the BRR samples (~8 of em) are at the tail end of memory, before the larger yellow echo region. In the region of BRR samples, the tiny strips of yellow are the BRR end blocks, which I counted up just now. So even though the echo region and BRR blocks are the same color, they are still easy to tell apart, due to the context.
Note: Technically, white can also mean a RWX access occurred, but it's uncommon. That's because Read = blue, write = green, execution = red => b + g + r => white.
Note2: Actually, you can find a tiny sliver of yellow on top of the red. This is signifying an area that has been both written to (green) and executed from (red). green + red => yellow.
It might help to know more about how the color math works. vspcplay, the code that the debugger is based off (with Raph's permission), uses maxed out RGB values for its colors. This simplifies the color math significantly. There is color math happening constantly, to combine what kind of memory accesses have occurred at a RAM address, and to fade out colors for memory access that has gone dormant (whether read/write/execute/echo). For example, READ + WRITE = cyan because read=blue and write=green => blue + green => cyan.
With this system, it is easy to tell apart color combinations since they are so absolute. But If the colors defining each access were mixed themselves, it would become harder to tell apart mixes of mixes of color!
More example of how the color math works: let's say there were both reads and writes happening for a period of time, the memory turns cyan (blue + green), and soon after let's say there are still writes but no more reads for several seconds. The memory will start to become only green.
Yellow of course was a compromise - since there are only 3 colors to choose from in raph's implementation (rgb). As an echo region it's not a big deal since that region is not expected to incur much varied action. For similar reasons I chose to mark BRR end blocks with that color. Remember the color fades out (leaving a faint mark).
Now that you know a little bit more about how it works, what do you think?
