mismatch between the next suggestion point (optimizer.suggest(utility)) and the argmax(EI) value
Hello. Thanks for your bayesian optimization codes, it's really helpful. I have a question in a suggestion mechanism. When I run the code, there was a next suggestion point mismatch, between the value suggested by optimizer.suggest(utility) and the value by argmax(EI).
I set the simple 1-D target function f and the code is as follows:
from bayes_opt import BayesianOptimization
from bayes_opt import UtilityFunction
from scipy.stats import norm
import numpy as np
import matplotlib.pyplot as plt

def target(x):
    return np.exp(-(x-3)**2) + np.exp(-(3*x-2)**2) + 1/(x**2+1)
pbounds = {'x': (-2, 6)}
X = np.arange(pbounds['x'][0], pbounds['x'][1], 1e-03).reshape(-1, 1)

def posterior(optimizer, x_obs, y_obs, grid):
    mu, sigma = optimizer._gp.predict(grid, return_std=True)
    return mu.reshape(-1, 1), sigma.reshape(-1, 1)

def obs(optimizer): # observations
    x_obs = np.array([[res["params"]["x"]] for res in optimizer.res]).reshape(-1, 1)
    y_obs = np.array([res["target"] for res in optimizer.res]).reshape(-1, 1)
    return [x_obs, y_obs]

test_optimizer0 = BayesianOptimization(f=target, pbounds=pbounds, random_state=0)
utility = UtilityFunction(kind="ei", kappa=0.0, xi=0.01)
test_optimizer0.maximize(init_points=2, n_iter=0, acq='ei', xi=0.01) # set two initial points
and run below in jupyter notebook
for i in range(14):
    next_point_to_probe = test_optimizer0.suggest(utility)
    print(next_point_to_probe)
    test_optimizer0.register(next_point_to_probe['x'], target(next_point_to_probe['x']))

    x_obs = obs(test_optimizer0)[0]
    y_obs = obs(test_optimizer0)[1]
    mu, sigma = posterior(test_optimizer0, x_obs, y_obs, grid=X)

    # ETC plot properties
    fig = plt.figure(figsize=(20, 10))
    plt.plot(X, target(X), 'b-', lw=2, label='known_target')
    plt.plot(x_obs[:-2], y_obs[:-2], 'rD', markersize=8, label='observations')
    for i in range(x_obs.shape[0]-2):
        plt.text(x_obs[i], -0.2, str(i+1), fontsize=12)
    plt.plot(x_obs[-2], y_obs[-2], 'r*', markersize=15, label='just_before_suggestion')
    plt.text(x_obs[-2], -0.2, str(len(x_obs)-1), fontsize=12, color='red')

    # GP plot
    plt.plot(X, mu, 'k--', lw=2, label='GP_mu')
    plt.plot(X, mu+sigma, 'g-', lw=0.5, label='GP_mu +- GP_sigma')
    plt.plot(X, mu-sigma, 'g-', lw=0.5)
    plt.fill(np.concatenate([X, X[::-1]]), np.concatenate([mu + sigma, (mu - sigma)[::-1]]), alpha=0.3, label='uncertain area')
    plt.xlim((-2.1, 6.1))
    plt.ylim((-0.25, 1.75))
    plt.legend()
    plt.show()

    # EI plot
    fig = plt.figure(figsize=(20, 5))
    EI = utility.utility(X, test_optimizer0._gp, test_optimizer0._space.target.max())
    plt.plot(X, EI, 'y-', lw=2, label='EI')
    plt.plot(X[np.argmax(EI)], np.max(EI), 'm*', markersize=15, label='next_suggestion')
    plt.xlim((-2.1, 6.1))
    plt.legend()
    plt.show()
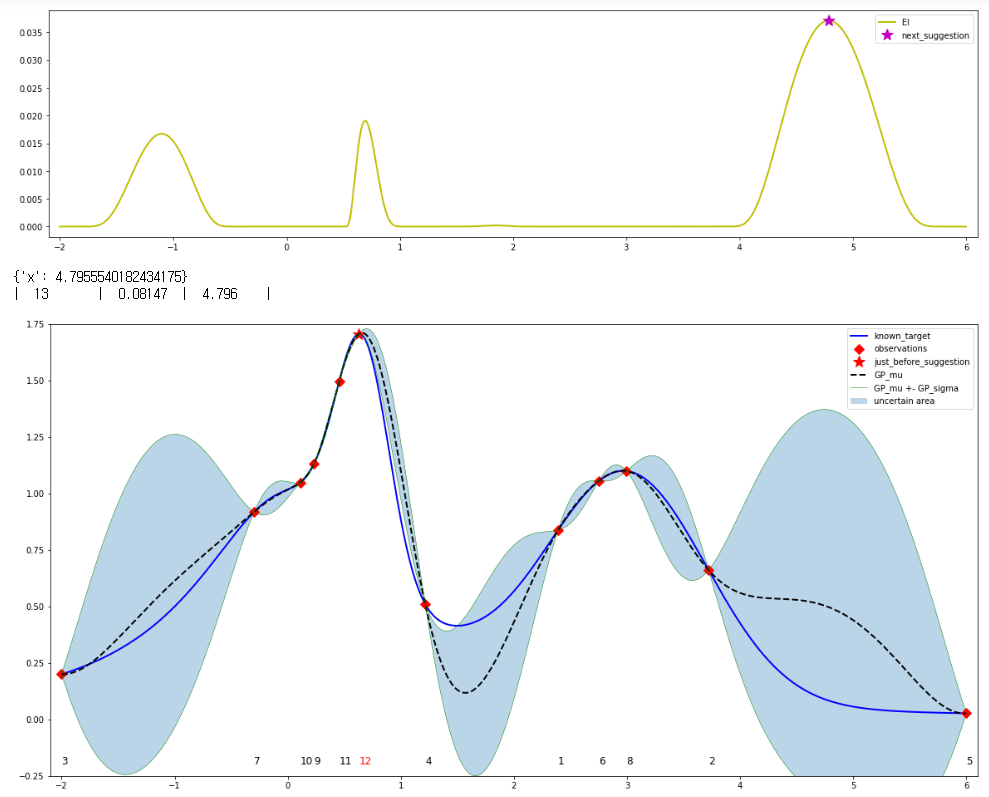
In each iteration, red star is the prior suggestion point and the violet star is the next suggestion point achieved from argmax(EI). EI was calculated from UtilityFunction.utility(~). And I also printed the test_optimizer0.suggest(utility) value, too.
But as seen in the results, there were some mismatching points, such as between iteration 6th-7th, 9th-10th, 12th-13th (i.e. argmax(EI) != test_optimizer0.suggest(utility)).
I attach the 12th-13th figure: as seen, the locations of the violet star(near 5) and the red star(between 0~1) are different.
I can't figure out the reason.
Thanks in advance :-)
Yeah, I've noticed this too, I have some suspicions, but let me run some tests with the scripts you uploaded.
Hey, I just re-ran this example, and I can't reproduce this behavior. @shoh4486 I realise this was a very long time ago now - I'm hoping this has been fixed in one of the many changes to the code and I can close this issue...