Switch Recipes PriorOverview _all_exprs -> _all_active_exprs
A element of prior can be const. So far these are not plotted (and there probably is no need to anyways). This patch reenables to plot overview on priors which have constant elements aka number of elements in totalndof/_all_active_exprs is smaller than in implementation _all_exprs.
One could open up a TODO to plot prior overviews by Symbol and Expr as well (those are the accepted vsel arguments for a single plot)
Additional work needs to be done if a element should be displayed with the same shape, as it is provided by a ShapedAsNT prior.
Essentially, if you want to test this you need a DensitySampleVector samples, based on a prior with const values.
I.e.
using BAT
using ValueShapes
using DensityInterface
using Distributions
using Plots

N = 100

prior = NamedTupleDist(ShapedAsNT, #<- optional, but required for unshaped.(samples)
    a = 1,
    b = reshape(product_distribution(fill(Normal(1),6)),2,3),
    c = Uniform(0,1),
)
vs = valshape(prior)

X = rand(prior,N)
usamples = DensitySampleVector(unshaped.(X),logdensityof(prior).(X))
samples = vs.(usamples)

plot(usamples, 1)
plot(samples, :(b[1]))
plot(samples, vsel=1:3)
The suggestions concern functionality not available atm
plot(samples, vsel=[:(b[1]),:(b[2])]
plot(samples, :(b[1,2])) #<- consider b is a 2x3 Matrix
Plotting by index is still unsupported
plot(samples,1)
Hello!
I think your patch definitely makes sense, but perhaps @Cornelius-G should look at this first.
To actually plot the const values of a prior, I believe we'd have to create an array like fill(const_value, N) or so at some point, since the parameters in a DensitySampleVector with a ConstValueShape don't actually hold the values as arrays.
When I came across this issue I thought that would be inelegant so I postponed that decision.
As for the selection of parameters via flat indexes, this is addressed here: https://github.com/bat/BAT.jl/pull/380
The processing of the vsel for the plotting recipes is handled via bat_marginalize().
In the implementation I suggest in https://github.com/bat/BAT.jl/pull/380, the flat indexes are blind to parameters with ConstValueShapes, so only entries in the DensitySampleVector that contribute to the totalndof() of that vector can be accessed via flat indexes.
If you wish to select a const value, you can do so via an expression like :(a[1,2]) if a is a ConstValueShape holding a 2D Matrix for example.
The relevant functions for this are in lines 100-147 (for the selection of ConstValueShapes) and 158-207 (for the flat indexes) of src/plotting/vsel_processing.jl if you want to look at this for yourself.
But I believe @Cornelius-G is still in the process of reviewing that.
I found the business of handling ConstValueShapes quite tricky, so I hope it isn't very relevant in practice.
I hope I could help. Cheers!
Could you elaborate on your last suggestion about the element being displayed in the same shape as it is provided in the pior? I don't quite understand what you mean.
It is possible to select certain parameters from a shaped or unshaped DensitySampleVector via bat_marginalize() and have them stored in a new DensitySampleVector in the same shape. The documentation for this is in lines 225-279 of src/plotting/vsel_processing.jl
, I believe we'd have to create an array like fill(const_value, N) or so at some point,
I wouldn't recommend following exactly that fill approach (although there is neat FillArrays.jl already used somewhere). Thing is, if a ConstValueShape on a holds non-scalar values, there is no guarantee all are equal.
prior = NamedTupleDist(ShapedAsNT,
    a = reshape(1:6,2,3),
    ....
)
# But accessing values ist possible though:
vs = varshape(prior)
@show vs.a.shape.value
so I hope it isn't very relevant in practice. So far these [const valued elements of prior] are not plotted (and there probably is no need to anyways).
Coming to think of it, I think in times it might be neat to show correlation of a const valued to a non-const - so essentially a horizontal / vertical line with contour.
If you wish to select a const value, you can do so via an expression like :(a[1,2]) if a is a ConstValueShape holding a 2D Matrix for example.
This is not possible atm in PriorOverview on non-const nor const whilst it is possible to visualize single elements of prior thatway. I think at least this one is to blame.
The latter is not currently supported, right?
plot(samples, :(b[1,2]))
ERROR: ArgumentError: Symbol :b[1, 2] found not in NamedTupleShape(ShapedAsNT,
Could you elaborate on your last suggestion about the element being displayed in the same shape as it is provided in the pior? I don't quite understand what you mean.
In my mind it would be very tempting to see the output of either
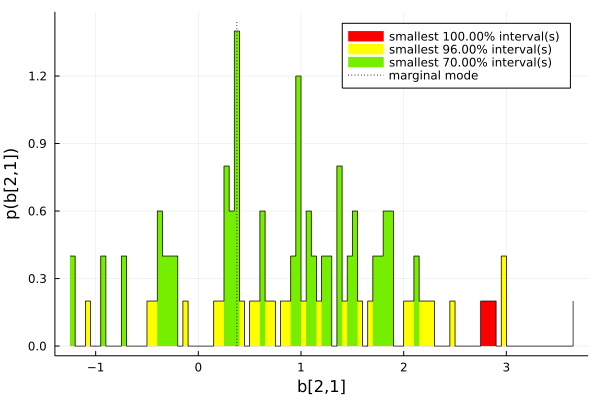
plot(samples, :(b[2,1]))
plot(samples, 2)
firstly to work of course, but also in the way that they label axis in this way by default
plot(usamples,2,xlabel="b[2,1]",ylabel="p(b[2,1])")
Featuring sth like
plot(samples, [vsel=]:(b[:,1]) )
would be marvelous, but I think
plot(samples, vsel=[eval(Meta.parse(":(b[$i,1])")) for i in 1:2])
is enough from a user perspective.
Unfortunately I don't have resources to approach this atm.
@oschulz
Would Base.collect(vs::ConstValueShape) = vs.shape.value be sth ValueShapes.jl could provide?
Would Base.collect(vs::ConstValueShape) = vs.shape.value be sth ValueShapes.jl could provide?
Hm, no, I don't think that is a good fit, semantically.
I wouldn't recommend following exactly that
fillapproach (although there is neat FillArrays.jl already used somewhere). Thing is, if a ConstValueShape onaholds non-scalar values, there is no guarantee all are equal.
I agree, but somehow the values to be plotted need to be put into a shape that can be plotted, and in my understanding that always needs to be as x-y pairs of values at some point.
The latter is not currently supported, right?
plot(samples, :(b[1,2]))ERROR: ArgumentError: Symbol :b[1, 2] found not in NamedTupleShape(ShapedAsNT,
If b in this example is a ConstValueShape, unfortunately this isn't currently supported, correct.
I will reach out to @Cornelius-G and discuss the issues you raised and your suggestion about the plotting of const values with with him.
Hi, I just tested the examples from @waldie11 in https://github.com/bat/BAT.jl/pull/386#issuecomment-1236379803. With PR #380 now everything works as expected, I guess. Only the line plot(samples, :(b[1,2])) #<- consider b is a 2x3 Matrix is not yet supported. Currently, only the linear indexing of multidimensional parameters like b is possible, i.e. plot(samples, :(b[3])) since b[1,2] = b[3] in this example.
@Micki-D could you give it a try to implement also the cartesian indexing of multidimensional arrays in plotting?
@Micki-D could you give it a try to implement also the cartesian indexing of multidimensional arrays in plotting?
Will do!
Let's bring this home. :-) @Micki-D and @Cornelius-G , can you check if this is good to merge?
Looks good from my side! I'm still working on the cartesian indexing for the vsel argument
I'm still working on the cartesian indexing for the vsel argument
So should we hold off on this, or will that be a separate PR?
Oh, no that will be a separate PR! In my opinion we can merge this PR here.