babelfish_extensions
 babelfish_extensions copied to clipboard
[Question]: Is anyone having performance issues?
Contact Details
What's the question?
Hello. We've been testing with some of our data, even with small tables.
- using tsql to get one record from a 2 row database may take 800ms, which is way too much.
- we had to transform gin indexes to other types, loosing the ability to use "like", in order to get some improvements... from 600ms to 90ms in small tables using a classic btree index.
this is very preliminar, however we are getting worse results comparing to a t2.small mssql server.
however, anyone is facing issues like this? I can provide more detailed information.
best regards, Mariano
Relevant log output or information
No response
Code of Conduct
- [X] I agree to follow this project's Code of Conduct
Babelfish does not yet support GIN indexes / full text search, but LIKE with wildcards is supported and can use a btree index access path on either a deterministic collation or a case-insensitive collation, if a suitable index is available. You wouldn't expect to see any I/O advantage using index based access on a 2-row table, though.
Can you provide more detail about your use case, and maybe post the DDL and before/after queries that you used? Also, does your use case require case-insensitive comparisons? accent-insensitive comparisons?
The total time overhead with a trivially small table may have more to do with planning-time overhead than execution-time overhead.
Hi Jim, here´s some detail on small executions that seem to have odd times:
We had a small tsql stored procedure that made a select from a small table of about 250 total rows.
CREATE procedure [dbo].[sp_getRulePolicyParametersAdmittedValues] @clientId smallint, @policyId smallint, @varName varchar(50) as select id,val from RulePolicyParametersAdmittedValues where clientId = @clientId and policyId = @policyId and varName = @varName GO
This procedure was then executed from our .net core app about 8 times in a row with different parameters values. What we observed is, that the first call to the stored procedure systematically took around 400ms. Then the others took almost no time at all.
We then swapped the SP written in tsql for another one created in the postgresql port:
CREATE OR REPLACE FUNCTION dbo.sp_getrulepolicyparametersadmittedvalues_fn( "@clientid" smallint, "@policyid" smallint, "@varname" character varying) RETURNS SETOF dbo.rulepolicyparametersadmittedvalues LANGUAGE 'sql' AS $BODY$ select * from dbo.rulepolicyparametersadmittedvalues where clientid = "@clientid" and policyid = "@policyid" and lower(varname) = lower("@varname"); $BODY$;
We ran again our .net code code, and this time even if we were connecting to the babel port of the database, the slow "first" call was gone, and everything went smoothly invoking the native function.
Maybe it's a planning time overhead, like you said, ant that's why the first query takes longer.
@setchego - execution of both a pl/tsql function and a pl/pgsql procedure causes the SQL statements it contains to be prepared when first encountered. This incurs parsing and planning overhead only once. This is true of both pl/tsql and pl/pgsql, but presently the overhead of pl/tsql parsing is higher, hence higher overhead on first execution in the pl/tsql case.
Hi Jim, thanks for your input. I understand what you say about parsing and planning before the actual execution.
I'm sharing a few measurements, maybe it helps for future improvements. My code is an AWS Lambda function calling this function about 8 times inside a loop with different parameter values.
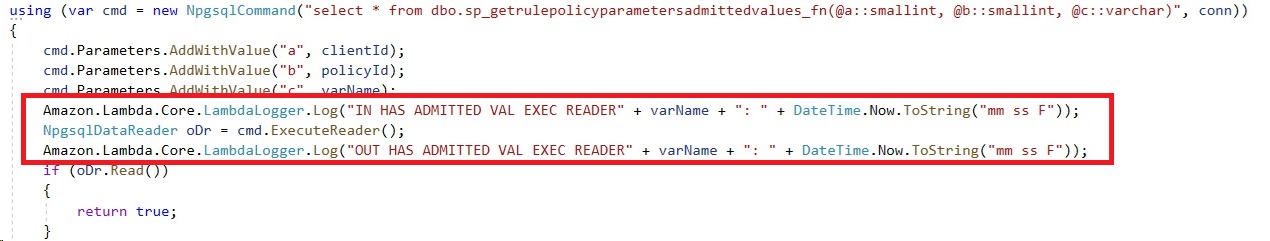
This would be the pgsql version, babel would be the same code but with a sqlCommand instead of an NpgsqlCommand. As you can see, logging happens right before and after the execute statement to avoid connection (and other stuff) being measured.
These would be the pgsql version readings:
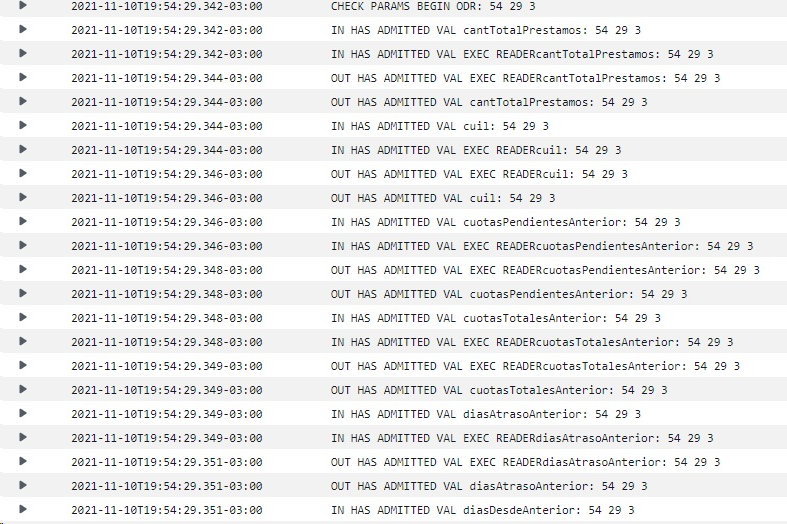 Everything seems to run in the same tenth of a second.
These would be the babel version readings:
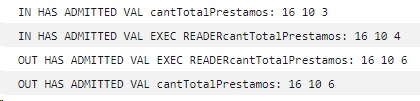
This first 200ms jump happens every time on the first of the 8 consecutive exec.
My code executes a bunch (10/20/30) small procedures like this. So those little 200ms on each one generate an extra 2 or 3 seconds in total. That's why I was surprised about the different total timings.
Thanks again
Yes, still working on this - will update as soon as we have some news.
-- Korry
Could you please check whether you still observe the performance issue in 4xdev?