opnsense_grafana_dashboard
 opnsense_grafana_dashboard copied to clipboard
Grafana Dashboard for OPNsense and the Plugin Sensei
Grafana Dashboard for OPNSense and Sensei
Grafana Dashboard for OPNsense and the Plugin Sensei
Requirement
- ELK stack 7+
- Telegraf configuration for OPNsense
- Grafana and InfluxDB
Grafana Plugins
- magnesium-wordcloud-panel
- flant-statusmap-panel
- grafana-piechart-panel
- grafana-worldmap-panel
- grafana-sankey-panel (https://github.com/kumaravel29/grafana-sankey-panel)
OPNsense configuration
- ELK logs, configure the ELK logs by following this : https://github.com/3ilson/pfelk
- Install Telegraf plugin and configure it to send metrics into InfluxDB
Grafana configuration
-
Configure the Datasource for InfluxDB
-
Configuration of the pfelk Elasticsearch Datasources :
  			Name : Elasticsearch-Firewall
  			URL : yourELKIP:9200
  			Index name : pfelk-firewall*
  			Time field name : @timestamp
  			Version : 7.0+

  			Name : Elasticsearch-Suricata
  			URL : yourELKIP:9200
  			Index name : pfelk-suricata*
  			Time field name : @timestamp
  			Version : 7.0+

  			Name : Elasticsearch-unbound
  			URL : yourELKIP:9200
  			Index name : pfelk-unbound*
  			Time field name : @timestamp
  			Version : 7.0+

  			You can use the Name you want and filter it in the dashboard your import, in the Settings -> Variables -> Elasticsearch
  			-> Adn modify the "Instance name filter" for exemple here for matching suricata : /.*Suricata.*/
Dashboard OPNSense :
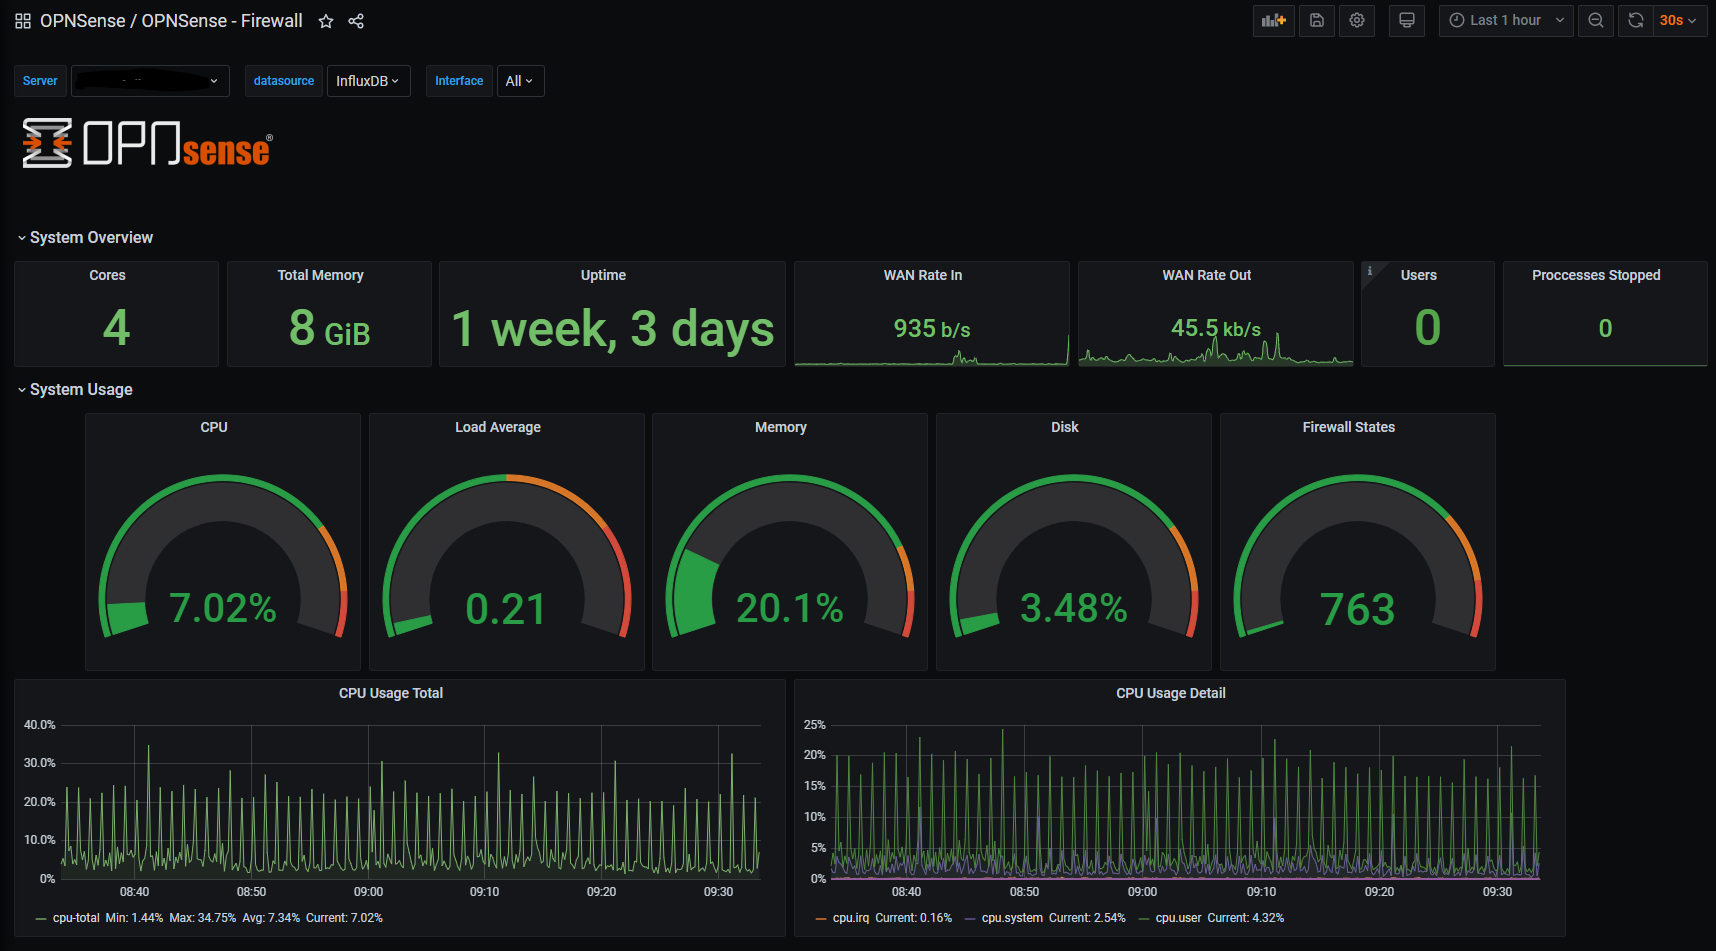
InfluxDB : OPNSense - Firewall
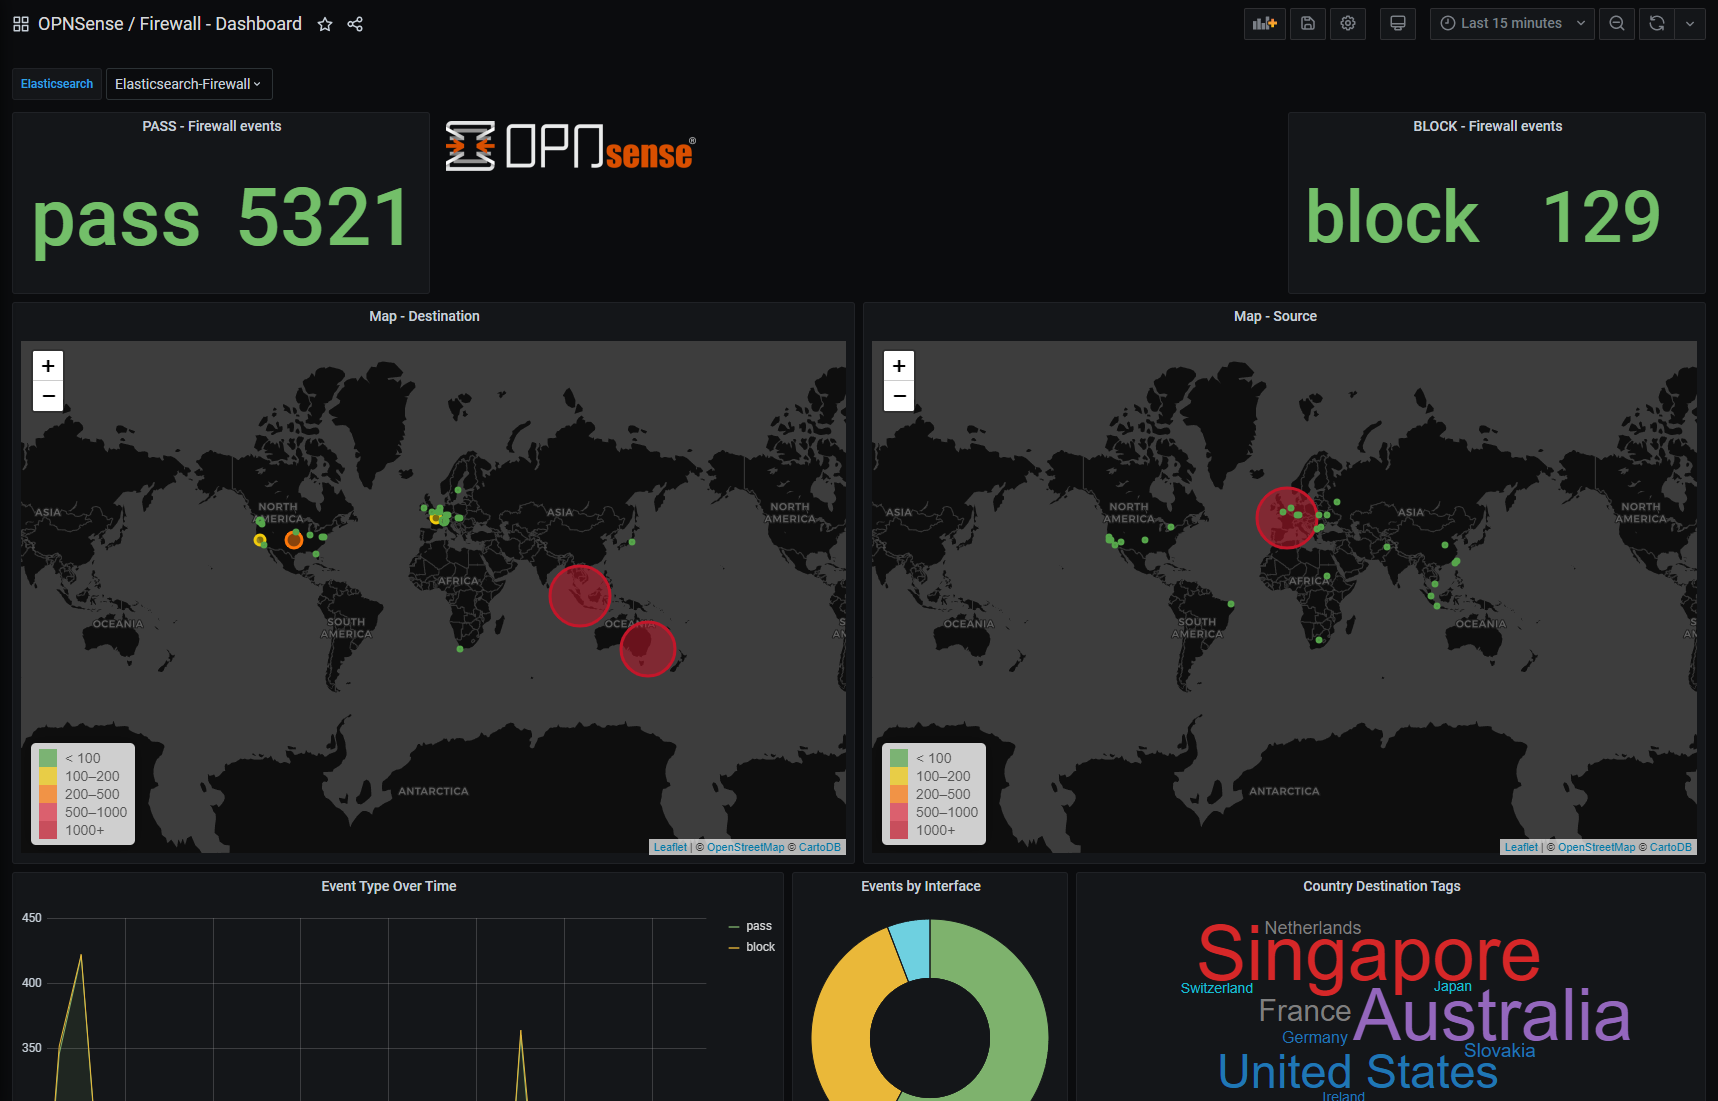
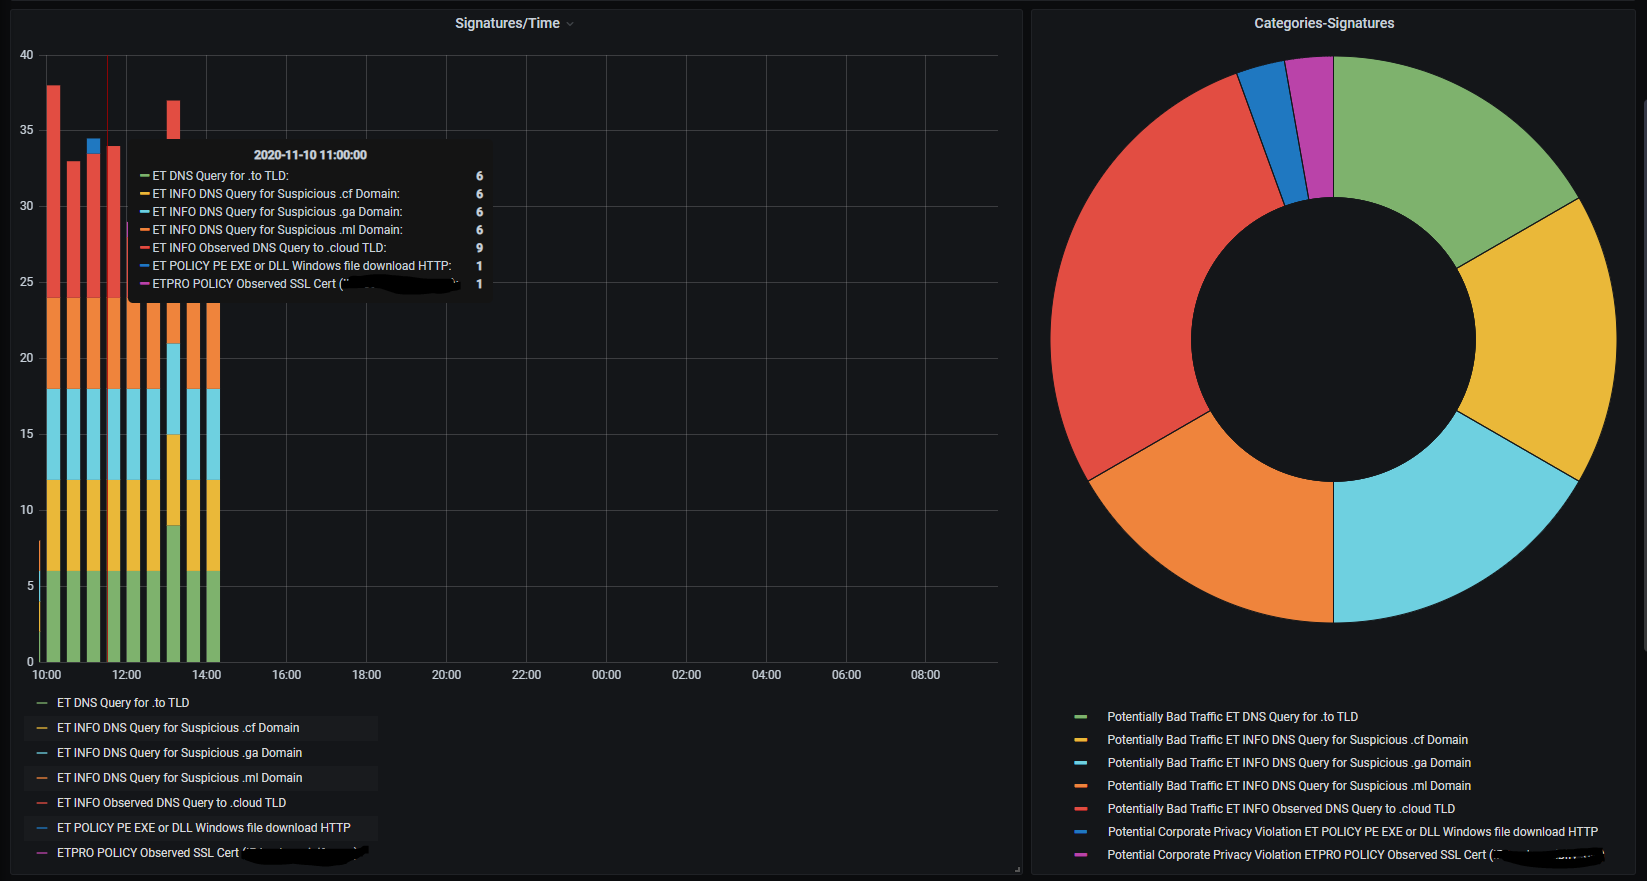
ELK : Firewall - Dashboard | Firewall - Suricata | Firewall - Unbound
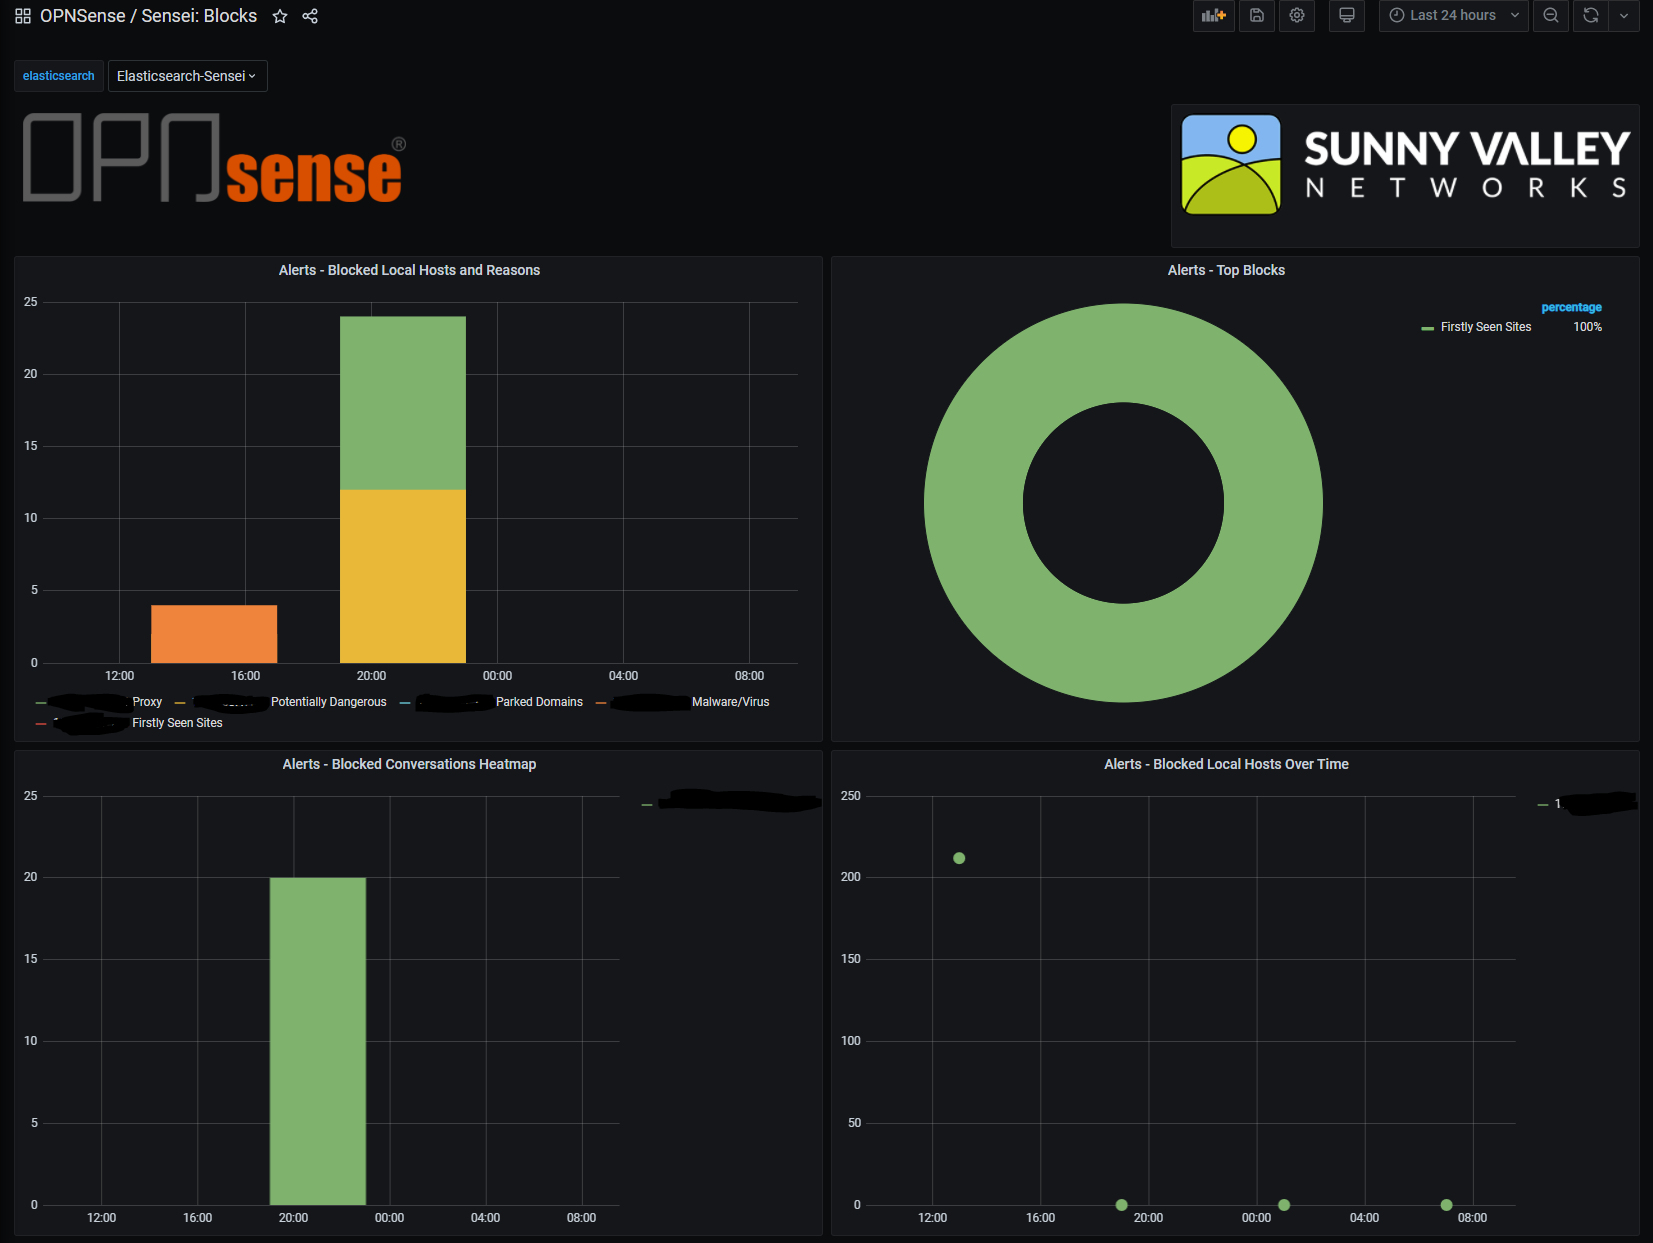
Configuration for Sensei Module https://docs.opnsense.org/vendor/sunnyvalley/sensei.html
Configure Sensei by using external ELK (like the one you have previously install) Or you can use the internal ELK who is install during the Sensei installation. Just configure a Port translation from your administration interface or OPNsense on the port 9200 to the 127.0.0.1:9200
- Configuration of the pfelk Elasticsearch Datasources : Name : Elasticsearch-Sensei URL : yourELKIP:9200 Index name : * Time field name : start_time Version : 7.0+ Or 5.6+(for Internal OPNsense Sensei ELK)
Grafana dashboard on grafana.com
- OPNSense_Firewall : https://grafana.com/grafana/dashboards/13386
- OPNSense Firewall Dashboard : https://grafana.com/grafana/dashboards/13383
- OPNSense Firewall Suricata : https://grafana.com/grafana/dashboards/13384
- OPNSense Firewall Unbound : https://grafana.com/grafana/dashboards/13385
- OPNSense Sensei Block : https://grafana.com/grafana/dashboards/13387
- OPNSense Sensei DNS : https://grafana.com/grafana/dashboards/13388
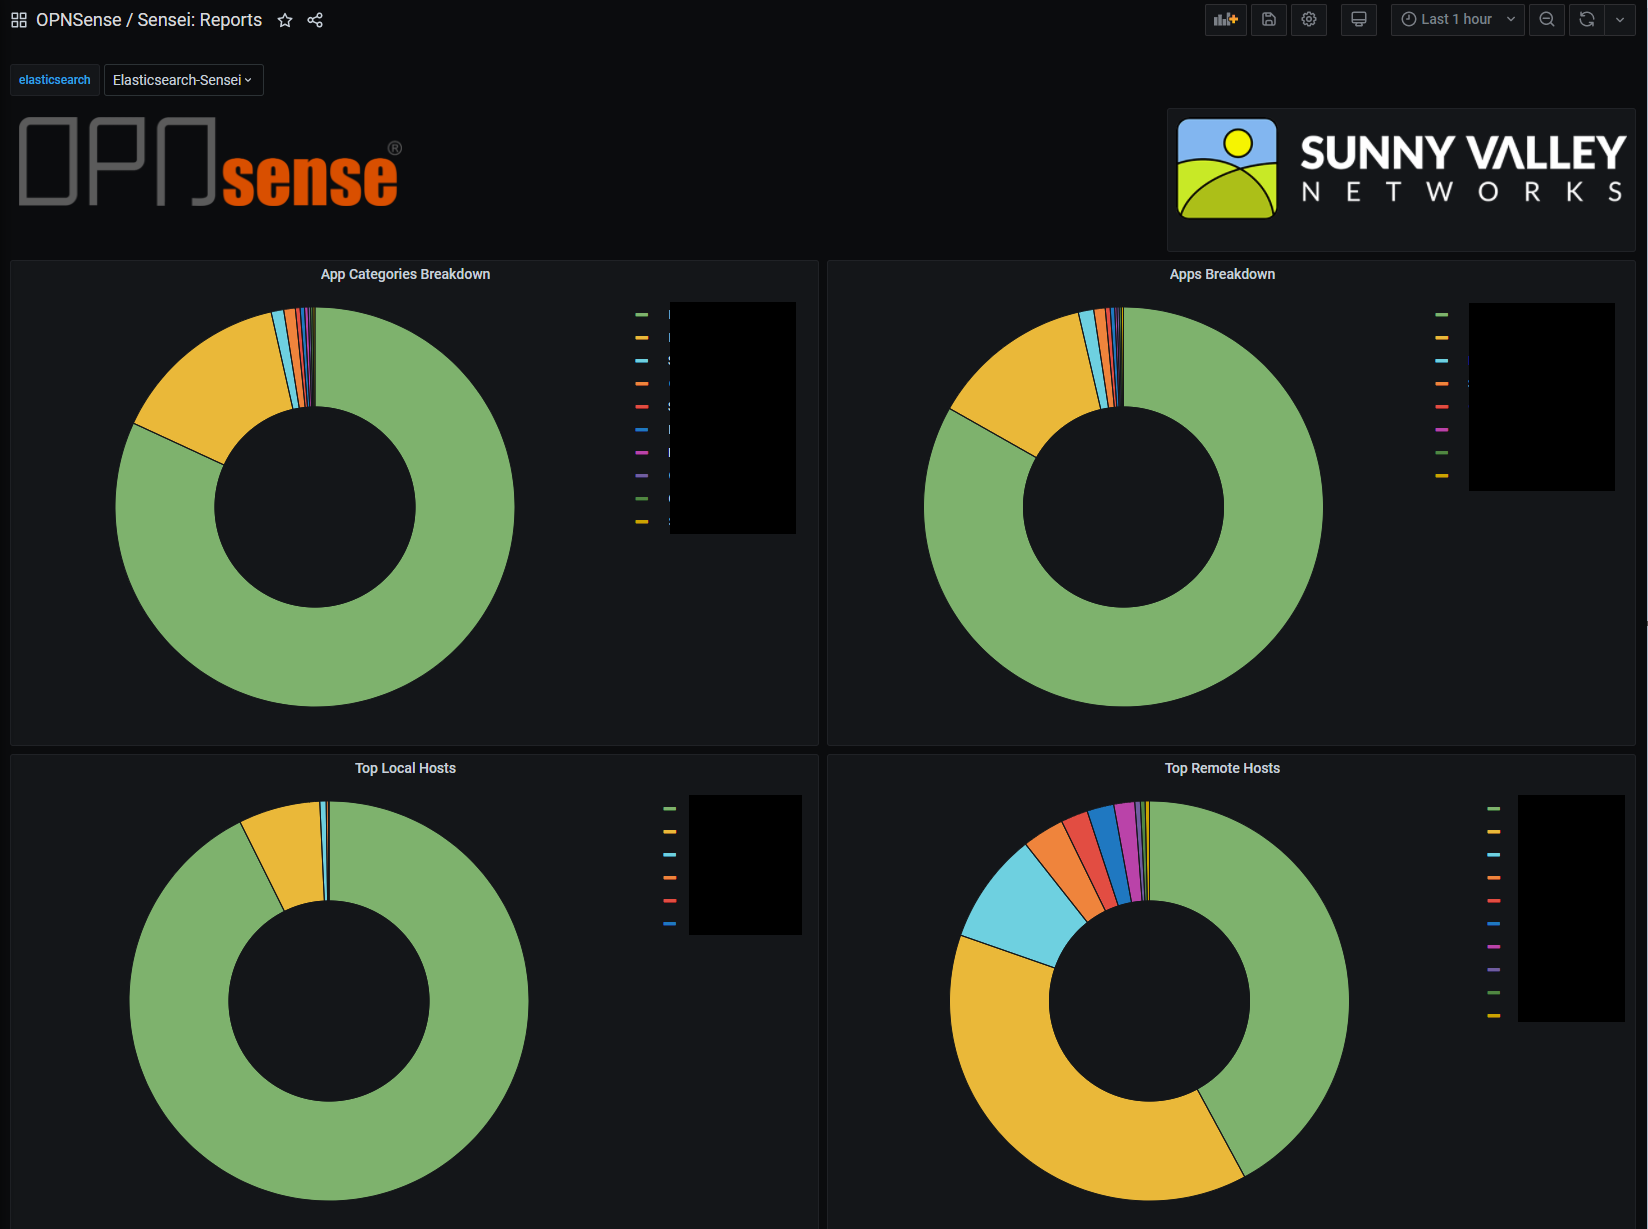
- OPNSense Sensei Reports : https://grafana.com/grafana/dashboards/13390
- OPNSense Sensei Threats : https://grafana.com/grafana/dashboards/13391
- OPNSense Sensei Web : https://grafana.com/grafana/dashboards/13392
OPNSense Firewall
OPNSense Firewall Dashboard
OPNSense Firewall Suricata
OPNSense Firewall Unbound

OPNSense Sensei Block
OPNSense Sensei DNS

OPNSense Sensei Reports
OPNSense Sensei Threats

OPNSense Sensei Web

Link : https://opnsense.org/ OPNsense is an OSS project © Deciso B.V. 2015-2020 - All rights reserved https://www.sunnyvalley.io/sensei/ Sunny Valley Networks name and logo are trademarks of Sunny Valley Cyber Security Inc. All other brand names, product names, or trademarks belong to their respective owners.
Metadata
Owner
Metadata
Grafana Dashboard for OPNsense and the Plugin Sensei