Gluon-Ts Multivariate : error while training
Description
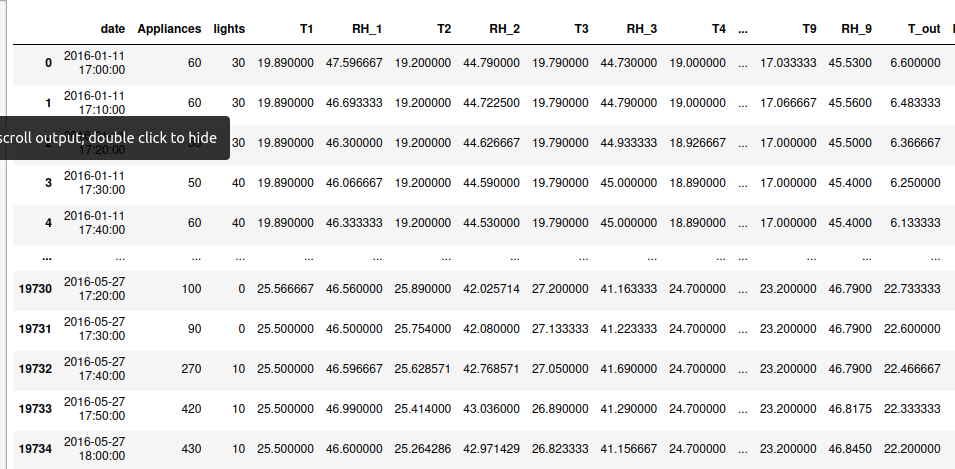
I was doing a multivariate analysis on a dataset on energy usage , and needed to predict the appliance usage from multivariate analysis on all attributes. But i was encountering with some errors while training data. I need some help in this.
[gluonts-Multivariate.pdf](https://github.com/awslabs/gluonts/files/9949237/gluonts-Multivariate.pdf)


## Error message or code output
GluonTSDataError: Input for field "target" does not have the requireddimension (field: target, ndim observed: 1, expected ndim: 2)
dataset
## Environment
- Operating system:Ubuntu 22.04
- Python version: 3.9.12
- GluonTS version: 0.11.1
- MXNet version: 1.9.1

----------
## code
import pandas as pd
import matplotlib as mpl
import matplotlib.pyplot as plt
from gluonts.model.deepvar import DeepVAREstimator
from gluonts.mx import Trainer
import numpy as np

df = pd.read_csv('https://archive.ics.uci.edu/ml/machine-learning-databases/00374/energydata_complete.csv')

df_input = df[['date','Appliances','T_out','Press_mm_hg','RH_out','Windspeed','Tdewpoint','Visibility']]
df_input = df_input.set_index('date')

train_time = "2016-05-10 00:00:00"
prediction_length = 100

estimator = DeepVAREstimator (freq="10min",
                             context_length=720,
                             prediction_length=prediction_length,
                             target_dim=2,
                             num_layers=2,
                             num_cells=128,
                             cell_type='lstm',
                             trainer=Trainer(epochs=3))

from gluonts.dataset.common import ListDataset
training_data = ListDataset(
     [{"start": df_input.index[0], "target": df_input.Appliances[:train_time]}],
     freq = "10min"
)

predictor = estimator.train(training_data=training_data)
Hi Nrebin,
I think the problem has to do with the number of target dimensions in your training data. I've added T_out as a second target dimension here. This runs on my system but let me know if it works for you.
First part of your code, unchanged
import pandas as pd
import matplotlib as mpl
import matplotlib.pyplot as plt
from gluonts.model.deepvar import DeepVAREstimator
from gluonts.mx import Trainer
import numpy as np

df = pd.read_csv('https://archive.ics.uci.edu/ml/machine-learning-databases/00374/energydata_complete.csv')

df_input = df[['date','Appliances','T_out','Press_mm_hg','RH_out','Windspeed','Tdewpoint','Visibility']]
df_input = df_input.set_index('date')

train_time = "2016-05-10 00:00:00"
prediction_length = 100

estimator = DeepVAREstimator (freq="10min",
                             context_length=720,
                             prediction_length=prediction_length,
                             target_dim=2,
                             num_layers=2,
                             num_cells=128,
                             cell_type='lstm',
                             trainer=Trainer(epochs=3))
Modified code for specifying training data
from gluonts.dataset.multivariate_grouper import MultivariateGrouper
grouper_train = MultivariateGrouper(max_target_dim=2)

# We want multiple target outputs, so we group them together using
# MultivariateGrouper
from gluonts.dataset.common import ListDataset
training_data = grouper_train([
    ListDataset(
     [{"start": df_input.index[0], "target": df_input.Appliances[:train_time]}],
     freq = "10min"
    )[0],
    ListDataset(
     [{"start": df_input.index[0], "target": df_input['T_out'][:train_time]}],
     freq = "10min"
    )[0],
])

predictor = estimator.train(training_data=training_data)
Similarly, we group together the test data for the two target outputs
grouper_test = MultivariateGrouper(num_test_dates=1, max_target_dim=2)

test_data = grouper_test([
    ListDataset(
    [
    {"start": df_input.index[0], "target": df_input.Appliances[:"2016-05-11 00:00:00"]},
    ],
    freq = "10min"
    )[0],
    ListDataset(
    [
    {"start": df_input.index[0], "target": df_input['T_out'][:"2016-05-11 00:00:00"]},
    ],
    freq = "10min"
    )[0]
]) + grouper_test([
    ListDataset(
    [
    {"start": df_input.index[0], "target": df_input.Appliances[:"2016-05-15 00:00:00"]},
    ],
    freq = "10min"
    )[0],

    ListDataset(
    [
    {"start": df_input.index[0], "target": df_input['T_out'][:"2016-05-15 00:00:00"]},
    ],
    freq = "10min"
    )[0]
])
This final part is unchanged
from gluonts.evaluation.backtest import make_evaluation_predictions

forecast_it, ts_it = make_evaluation_predictions(
dataset=test_data,
predictor=predictor,
num_samples=100,
)

forecasts = list(forecast_it)
tss = list(ts_it)

forecast_entry = forecasts [0]
I hope that helps, and let me know how you get on.
@sighellan Can you suggest code for plotting this predicted data and test data
There's an open PR (#2338), trying to unify plotting utilities. This function allows plotting multivariate forecasts, either in subplots (use_subplots=True) or all in one plot (which gets messy quickly, depending on the chosen quantiles). Maybe you can take some inspiration there to plot your data.
@sighellan @lostella May I ask if the sampling for multivariate prediction is done from a joint distribution of multiple variables? Is the quantile taken here the quantile of the joint distribution?